Georgia is the #15 largest school system in the United States, serving 1,747,653 students across the 2,330 public schools for the 2025 school year (there are 921 private schools, serving 164,189 students). 91% of all K-12 students in Georgia attend public schools, compared to the national average of 90%.
The percentage of students achieving math proficiency in Georgia is 38%. The percentage of students achieving reading proficiency is 40%.
The top-ranked public schools in Georgia are Kittredge Magnet School, Gwinnett School Of Mathematics- Science And Technology, and Britt David Elementary Computer Magnet Academy. Overall testing rank is based on a school's combined math and reading proficiency test scores.
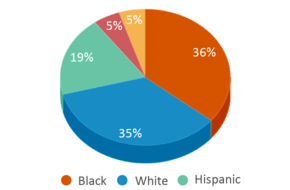
Minority enrollment is 65%, with the majority being Black and the student:teacher ratio is 14:1.
Student by Ethnicity
(GA) School Average
Asian
5%
Hispanic
19%
Black
36%
White
35%
Two or more races
5%

Top Ranked Public Schools in Georgia (2025)
School
(Math and Reading Proficiency)
(Math and Reading Proficiency)
Student Proficiency
Grades
Location
Rank: #11.
Kittredge Magnet School
Magnet School
(Math: 97% | Reading: ≥99%)
Rank:
Rank:
10/
Top 1%10
Math: 97% (Top 1%)
Reading: ≥99% (Top 1%)
Grades: 4-6
2383 N Druid Hills Rd Ne
Atlanta, GA 30329
(678) 874-6602
Atlanta, GA 30329
(678) 874-6602
Rank: #22.
Gwinnett School Of Mathematics- Science And Technology
(Math: ≥95% | Reading: ≥99%)
Rank:
Rank:
10/
Top 1%10
Math: ≥95% (Top 1%)
Reading: ≥99% (Top 1%)
Grades: 9-12
970 Mcelvaney Ln
Lawrenceville, GA 30044
(678) 518-6700
Lawrenceville, GA 30044
(678) 518-6700
Rank: #33.
Britt David Elementary Computer Magnet Academy
Magnet School
(Math: 94% | Reading: 94%)
Rank:
Rank:
10/
Top 1%10
Math: 94% (Top 1%)
Reading: 94% (Top 1%)
Grades: K-5
5801 Armour Rd
Columbus, GA 31909
(706) 748-2617
Columbus, GA 31909
(706) 748-2617
Rank: #44.
Wadsworth Magnet School For High Achievers
Magnet School
(Math: 90-94% | Reading: ≥95%)
Rank:
Rank:
10/
Top 1%10
Math: 90-94% (Top 1%)
Reading: ≥95% (Top 1%)
Grades: 4-8
3039 Santa Monica Dr
Decatur, GA 30032
(678) 874-2402
Decatur, GA 30032
(678) 874-2402
Rank: #55.
Simpson Elementary School
(Math: 90% | Reading: 88%)
Rank:
Rank:
10/
Top 1%10
Math: 90% (Top 1%)
Reading: 88% (Top 1%)
Grades: PK-5
4525 E Jones Bridge Rd
Peachtree Corners, GA 30092
(770) 417-2400
Peachtree Corners, GA 30092
(770) 417-2400
Rank: #66.
Daves Creek Elementary School
(Math: 94% | Reading: 85%)
Rank:
Rank:
10/
Top 1%10
Math: 94% (Top 1%)
Reading: 85% (Top 1%)
Grades: PK-5
3740 Melody Mizer Ln
Cumming, GA 30041
(770) 888-1222
Cumming, GA 30041
(770) 888-1222
Rank: #77.
Marietta Center For Advanced Academics
(Math: 88% | Reading: 87%)
Rank:
Rank:
10/
Top 1%10
Math: 88% (Top 1%)
Reading: 87% (Top 1%)
Grades: 3-5
311 Aviation Rd Se
Marietta, GA 30060
(770) 420-0822
Marietta, GA 30060
(770) 420-0822
Rank: #88.
Elite Scholars Academy School
(Math: 86% | Reading: 92%)
Rank:
Rank:
10/
Top 1%10
Math: 86% (Top 1%)
Reading: 92% (Top 1%)
Grades: 6-12
7923 Fielder Rd
Jonesboro, GA 30236
(770) 472-2823
Jonesboro, GA 30236
(770) 472-2823
Rank: #9 - 109. - 10.
Level Creek Elementary School
(Math: 88% | Reading: 85%)
Rank:
Rank:
10/
Top 1%10
Math: 88% (Top 1%)
Reading: 85% (Top 1%)
Grades: PK-5
4488 Tench Rd
Suwanee, GA 30024
(770) 904-7950
Suwanee, GA 30024
(770) 904-7950
Rank: #9 - 109. - 10.
Timber Ridge Elementary School
(Math: 87% | Reading: 87%)
Rank:
Rank:
10/
Top 1%10
Math: 87% (Top 1%)
Reading: 87% (Top 1%)
Grades: PK-5
5000 Timber Ridge Rd
Marietta, GA 30068
(770) 642-5621
Marietta, GA 30068
(770) 642-5621
Best Georgia Public Schools by County (2025)
Popular neighborhoods: East Columbus (11 schools), Midtown (10 schools), Buckhead (6 schools), Gwinnett Village (6 schools), Cliftondale (4 schools).
County
# Schools
# Students
% Minority
Frequently Asked Questions
What are the top ranked public schools in Georgia?
The top-ranked public schools in Georgia include Kittredge Magnet School, Gwinnett School Of Mathematics- Science And Technology, and Britt David Elementary Computer Magnet Academy.
How many public schools are located in Georgia?
2,330 public schools are located in Georgia.
What percentage of students in Georgia go to public school?
91% of all K-12 students in Georgia attend public schools (compared to the national average of 90%).
What is the racial composition of students in Georgia?
Minority enrollment in Georgia is 65%, with the majority being Black.
Which public schools in Georgia are often viewed compared to one another?
Popular comparisons of public schools in Georgia include: Midway Hills Primary vs. Lakeview Primary, Habersham Success Academy vs. Habersham Central High School, Haralson County High School vs. Bremen High School
Recent Articles

What Is A Charter School?
Explore the world of charter schools in this comprehensive guide. Learn about their history, how they operate, and the pros and cons of this educational innovation. Discover key facts about charter schools, including admission policies, demographics, and funding, as well as what to look for when considering a charter school for your child.

10 Reasons Why High School Sports Benefit Students
Discover the 10 compelling reasons why high school sports are beneficial for students. This comprehensive article explores how athletics enhance academic performance, foster personal growth, and develop crucial life skills. From improved fitness and time management to leadership development and community representation, learn why participating in high school sports can be a game-changer for students' overall success and well-being.

February 05, 2025
Understanding the U.S. Department of Education: Structure, Impact, and EvolutionWe explore how the Department of Education shapes American education, from its cabinet-level leadership to its impact on millions of students, written for general audiences seeking clarity on this vital institution.


