Massachusetts is the #21 largest school system in the United States, serving 916,334 students across the 1,837 public schools for the 2025 school year (there are 861 private schools, serving 127,446 students). 88% of all K-12 students in Massachusetts attend public schools, compared to the national average of 90%.
The percentage of students achieving math proficiency in Massachusetts is 42%. The percentage of students achieving reading proficiency is 45%.
The top-ranked public schools in Massachusetts are Acton-boxborough Regional High School, Mary Lee Burbank, and Weston High School. Overall testing rank is based on a school's combined math and reading proficiency test scores.
There are 66 Blue Ribbon Schools, 4 magnet schools, 77 charter schools, and 12 special education schools.
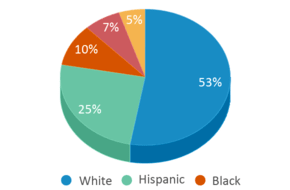
Minority enrollment is 47%, with the majority being Hispanic and the student:teacher ratio is 12:1.
Student by Ethnicity
(MA) School Average
Asian
7%
Hispanic
25%
Black
10%
White
53%
Two or more races
5%

Top Ranked Public Schools in Massachusetts (2025)
School
(Math and Reading Proficiency)
(Math and Reading Proficiency)
Student Proficiency
Grades
Location
Rank: #11.
Acton-boxborough Regional High School
(Math: 90% | Reading: 89%)
Rank:
Rank:
10/
Top 1%10
Math: 90% (Top 1%)
Reading: 89% (Top 1%)
Grades: 9-12
36 Charter Rd
Acton, MA 01720
(978) 264-4700
Acton, MA 01720
(978) 264-4700
Rank: #2 - 32. - 3.
Mary Lee Burbank
(Math: 85-89% | Reading: 85-89%)
Rank:
Rank:
10/
Top 1%10
Math: 85-89% (Top 1%)
Reading: 85-89% (Top 1%)
Grades: K-4
266 School Street
Belmont, MA 02478
(617) 993-5500
Belmont, MA 02478
(617) 993-5500
Rank: #2 - 32. - 3.
Weston High School
(Math: 85-89% | Reading: 85-89%)
Rank:
Rank:
10/
Top 1%10
Math: 85-89% (Top 1%)
Reading: 85-89% (Top 1%)
Grades: 9-12
444 Wellesley Street
Weston, MA 02493
(781) 786-5800
Weston, MA 02493
(781) 786-5800
Rank: #44.
Woodland
(Math: 80-89% | Reading: ≥90%)
Rank:
Rank:
10/
Top 1%10
Math: 80-89% (Top 1%)
Reading: ≥90% (Top 1%)
Grades: PK-3
10 Alphabet Lane
Weston, MA 02493
(781) 786-5300
Weston, MA 02493
(781) 786-5300
Rank: #55.
Lexington High School
(Math: 86% | Reading: 88%)
Rank:
Rank:
10/
Top 1%10
Math: 86% (Top 1%)
Reading: 88% (Top 1%)
Grades: 9-12
251 Waltham Street
Lexington, MA 02421
(781) 861-2320
Lexington, MA 02421
(781) 861-2320
Rank: #66.
Winchester High School
(Math: 84% | Reading: 90%)
Rank:
Rank:
10/
Top 1%10
Math: 84% (Top 1%)
Reading: 90% (Top 1%)
Grades: 9-12
80 Skillings Road
Winchester, MA 01890
(781) 721-7020
Winchester, MA 01890
(781) 721-7020
Rank: #77.
Boston Latin School
(Math: 85% | Reading: 87%)
Rank:
Rank:
10/
Top 1%10
Math: 85% (Top 1%)
Reading: 87% (Top 1%)
Grades: 7-12
78 Ave Louis Pasteur
Boston, MA 02115
(617) 635-8895
Boston, MA 02115
(617) 635-8895
Rank: #8 - 98. - 9.
Hingham High School
(Math: 82% | Reading: 91%)
Rank:
Rank:
10/
Top 1%10
Math: 82% (Top 5%)
Reading: 91% (Top 1%)
Grades: 9-12
17 Union Street
Hingham, MA 02043
(781) 741-1560
Hingham, MA 02043
(781) 741-1560
Rank: #8 - 98. - 9.
Hopkinton High School
(Math: 83% | Reading: 87%)
Rank:
Rank:
10/
Top 1%10
Math: 83% (Top 1%)
Reading: 87% (Top 1%)
Grades: 9-12
90 Hayden Rowe Street
Hopkinton, MA 01748
(508) 497-9820
Hopkinton, MA 01748
(508) 497-9820
Rank: #1010.
Norwell High School
(Math: 85-89% | Reading: 80-84%)
Rank:
Rank:
10/
Top 1%10
Math: 85-89% (Top 1%)
Reading: 80-84% (Top 5%)
Grades: 9-12
18 South Street
Norwell, MA 02061
(781) 659-8810
Norwell, MA 02061
(781) 659-8810
Best Massachusetts Public Schools by County (2025)
Popular neighborhoods: Sixteen Acres (11 schools), Liberty Heights (9 schools), Pine Point (9 schools), Highlands (8 schools), Forest Park (8 schools).
County
# Schools
# Students
% Minority
Frequently Asked Questions
What are the top ranked public schools in Massachusetts?
The top-ranked public schools in Massachusetts include Acton-boxborough Regional High School, Mary Lee Burbank, and Weston High School.
How many public schools are located in Massachusetts?
1,837 public schools are located in Massachusetts.
What percentage of students in Massachusetts go to public school?
88% of all K-12 students in Massachusetts attend public schools (compared to the national average of 90%).
What is the racial composition of students in Massachusetts?
Minority enrollment in Massachusetts is 47%, with the majority being Hispanic.
Which public schools in Massachusetts are often viewed compared to one another?
Popular comparisons of public schools in Massachusetts include: Wildwood vs. Boutwell, Oak Street Elementary School vs. Benjamin Franklin Classical Charter Public School, Oak Hill Middle School vs. Charles E Brown Middle School
Recent Articles

What Is A Charter School?
Explore the world of charter schools in this comprehensive guide. Learn about their history, how they operate, and the pros and cons of this educational innovation. Discover key facts about charter schools, including admission policies, demographics, and funding, as well as what to look for when considering a charter school for your child.

10 Reasons Why High School Sports Benefit Students
Discover the 10 compelling reasons why high school sports are beneficial for students. This comprehensive article explores how athletics enhance academic performance, foster personal growth, and develop crucial life skills. From improved fitness and time management to leadership development and community representation, learn why participating in high school sports can be a game-changer for students' overall success and well-being.

February 05, 2025
Understanding the U.S. Department of Education: Structure, Impact, and EvolutionWe explore how the Department of Education shapes American education, from its cabinet-level leadership to its impact on millions of students, written for general audiences seeking clarity on this vital institution.


