The percentage of students achieving proficiency in math was 85-89% (which was approximately equal to the Virginia state average of 87%). The percentage of students achieving proficiency in reading/language arts was 70-74% (which was lower than the Virginia state average of 89%).
School Overview
Grades Offered
Grades Prekindergarten-5
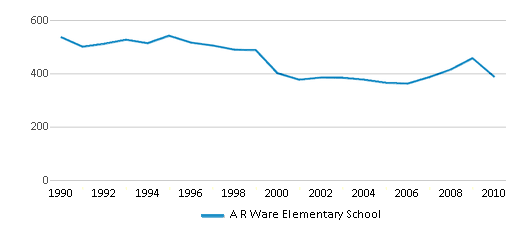
Total Students (09-10)
323 students
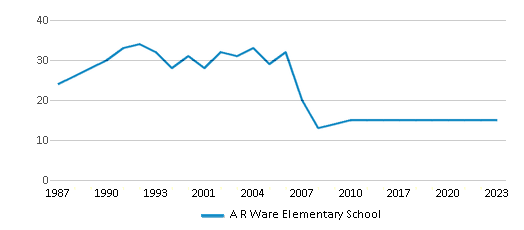
Total Classroom Teachers
15 teachers
School Rankings
Math Test Scores (% Proficient)
(09-10)85-89%
87%
Reading/Language Arts Test Scores (% Proficient)
(09-10)70-74%
89%
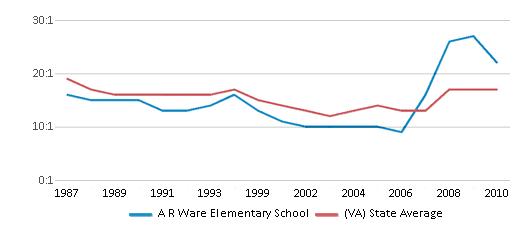
Student : Teacher Ratio
n/a
14:1
American Indian
(09-10)n/a
n/a
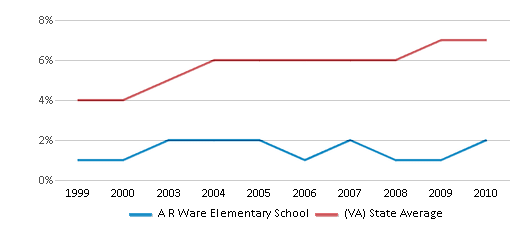
Asian
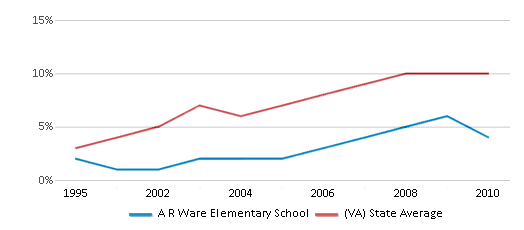
(09-10)2%
7%
Hispanic
(09-10)4%
10%
Black
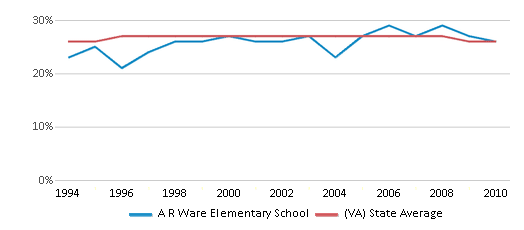
(09-10)26%
26%
White
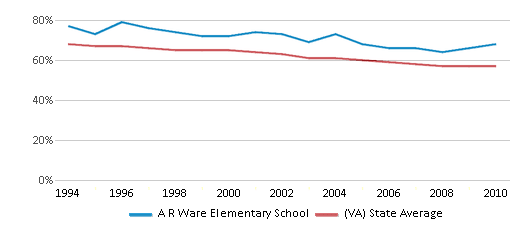
(09-10)68%
57%
Hawaiian
(09-10)n/a
n/a
Two or more races
(09-10)n/a
n/a
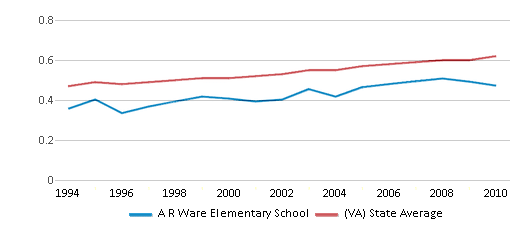
Eligible for Free Lunch (09-10)
59%
29%
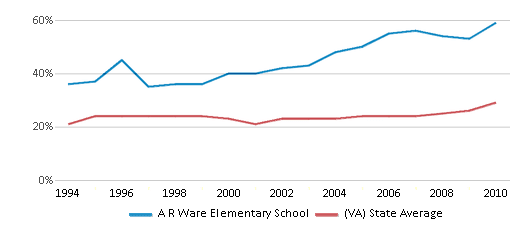
Eligible for Reduced Lunch (09-10)
10%
7%
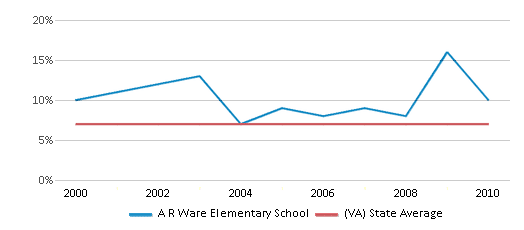
School Statewide Testing
School District Name
Source: National Center for Education Statistics (NCES), VA Dept. of Education
Frequently Asked Questions
What percent of students have achieved state testing proficiency in math and reading?
85-89% of students have achieved math proficiency (compared to the 87% VA state average), while 70-74% of students have achieved reading proficiency (compared to the 89% VA state average).
How many students attend A R Ware Elementary School?
323 students attend A R Ware Elementary School.
What is the racial composition of the student body?
68% of A R Ware Elementary School students are White, 26% of students are Black, 4% of students are Hispanic, and 2% of students are Asian.
What grades does A R Ware Elementary School offer ?
A R Ware Elementary School offers enrollment in grades Prekindergarten-5
What school district is A R Ware Elementary School part of?
A R Ware Elementary School is part of Staunton City Public Schools School District.
Recent Articles

What Is A Charter School?
Explore the world of charter schools in this comprehensive guide. Learn about their history, how they operate, and the pros and cons of this educational innovation. Discover key facts about charter schools, including admission policies, demographics, and funding, as well as what to look for when considering a charter school for your child.

10 Reasons Why High School Sports Benefit Students
Discover the 10 compelling reasons why high school sports are beneficial for students. This comprehensive article explores how athletics enhance academic performance, foster personal growth, and develop crucial life skills. From improved fitness and time management to leadership development and community representation, learn why participating in high school sports can be a game-changer for students' overall success and well-being.

February 05, 2025
Understanding the U.S. Department of Education: Structure, Impact, and EvolutionWe explore how the Department of Education shapes American education, from its cabinet-level leadership to its impact on millions of students, written for general audiences seeking clarity on this vital institution.


