Serving 307 students in grades Kindergarten-5, Academy For Enriched Sciences ranks in the top 5% of all schools in California for overall test scores (math proficiency is top 5%, and reading proficiency is top 5%).
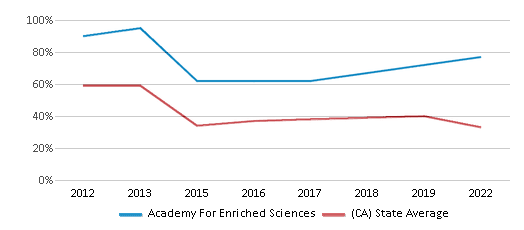
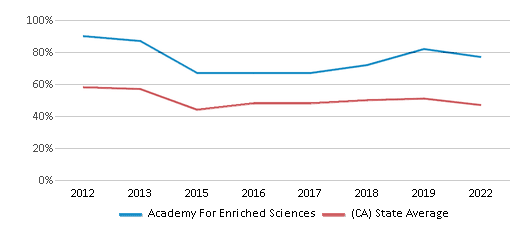
The percentage of students achieving proficiency in math is 75-79% (which is higher than the California state average of 33%). The percentage of students achieving proficiency in reading/language arts is 75-79% (which is higher than the California state average of 47%).
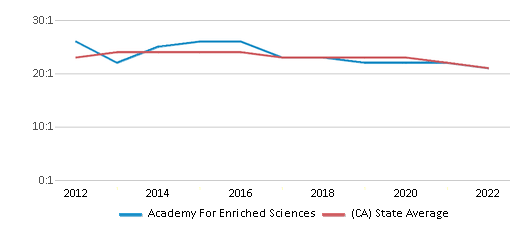
The student:teacher ratio of 24:1 is higher than the California state level of 21:1.
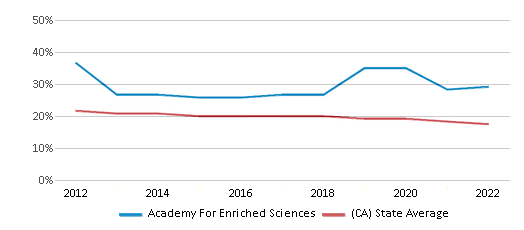
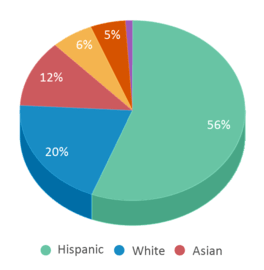
Minority enrollment is 66% of the student body (majority Hispanic), which is lower than the California state average of 80% (majority Hispanic).
Quick Stats (2025)
- Grades: Kindergarten-5
- Enrollment: 307 students
- Student:Teacher Ratio: 24:1
- Minority Enrollment: 66%
- Overall Testing Rank: Top 5% in CA
- Math Proficiency: 75-79% (Top 5%)
- Reading Proficiency: 75-79% (Top 10%)
- Science Proficiency: 60-69% (Top 10%)
- Source: National Center for Education Statistics (NCES), CA Dept. of Education
Top Rankings
Academy For Enriched Sciences ranks among the top 20% of public schools in California for:
Category
Attribute
Overall Rank
Math Proficiency
Reading/Language Arts Proficiency
Science Proficiency
School Overview
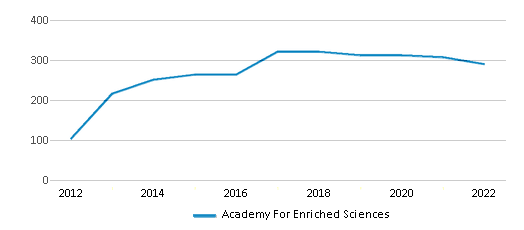
Academy For Enriched Sciences's student population of 307 students has stayed relatively flat over five school years.
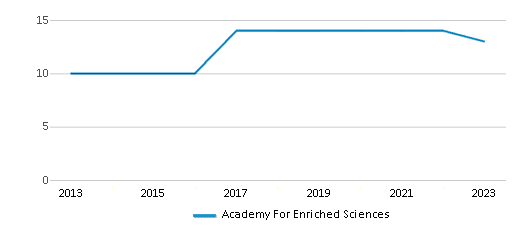
The teacher population of 13 teachers has declined by 7% over five school years.
Grades Offered
Grades Kindergarten-5
Total Students
307 students
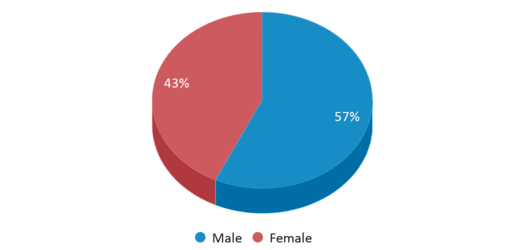
Gender %
Total Classroom Teachers
13 teachers
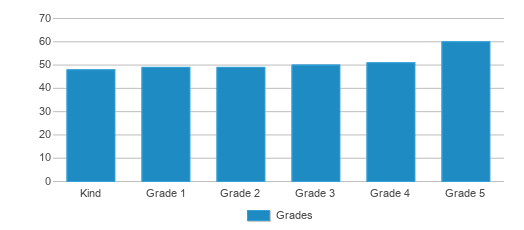
Students by Grade
School Rankings
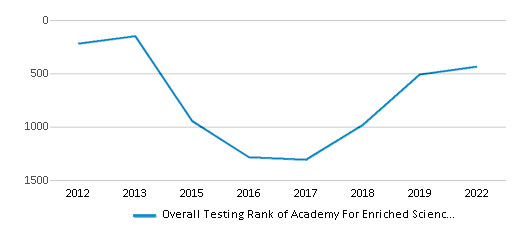
Academy For Enriched Sciences ranks within the top 5% of all 9,602 schools in California (based off of combined math and reading proficiency testing data).
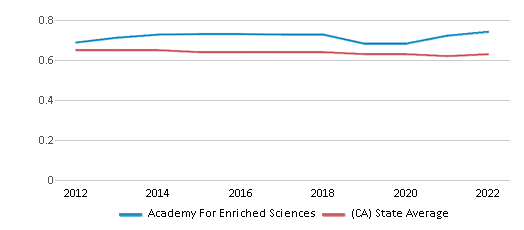
The diversity score of Academy For Enriched Sciences is 0.75, which is more than the diversity score at state average of 0.63. The school's diversity has stayed relatively flat over five school years.
Overall Testing Rank
#437 out of 9602 schools
(Top 5%)
(Top 5%)
Math Test Scores (% Proficient)
75-79%
33%
Reading/Language Arts Test Scores (% Proficient)
75-79%
47%
Science Test Scores (% Proficient)
60-69%
29%
Student : Teacher Ratio
24:1
21:1
American Indian
n/a
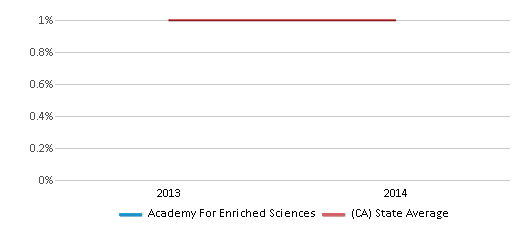
1%
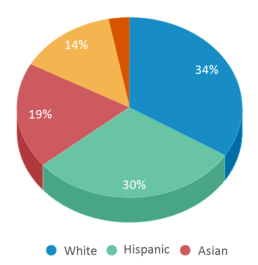
Asian
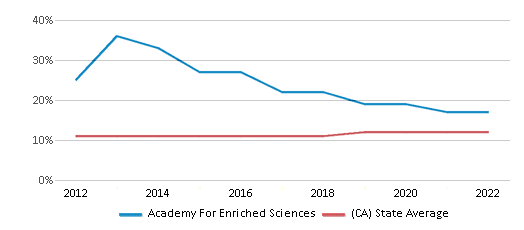
19%
12%
Hispanic
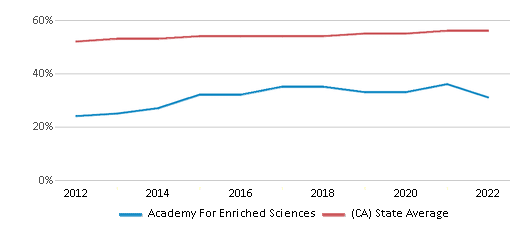
30%
56%
Black
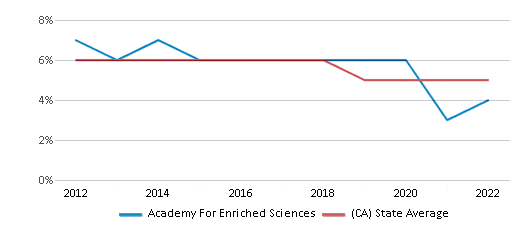
3%
5%
White
34%
20%
Hawaiian
n/a
n/a
Two or more races
14%
6%
All Ethnic Groups
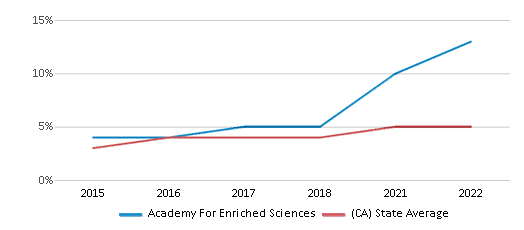
Eligible for Free Lunch
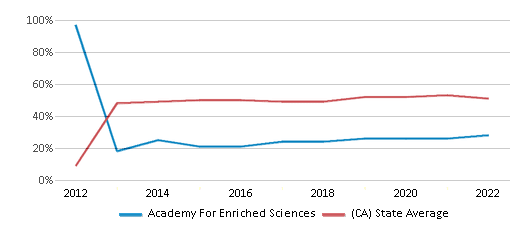
26%
54%
Eligible for Reduced Lunch
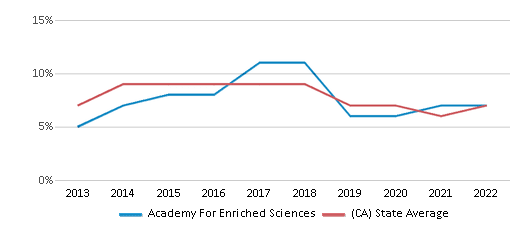
5%
8%
School Statewide Testing
School District Name
Source: National Center for Education Statistics (NCES), CA Dept. of Education
Profile last updated: 02/09/2025
Frequently Asked Questions
What is Academy For Enriched Sciences's ranking?
Academy For Enriched Sciences is ranked #437 out of 9,602 schools, which ranks it among the top 5% of public schools in California.
What schools are Academy For Enriched Sciences often compared to?
Academy For Enriched Sciencesis often viewed alongside schools like Encino Charter Elementary School, Welby Way Charter Elementary Sch And Gifted-high Ability Magnet by visitors of our site.
What percent of students have achieved state testing proficiency in math and reading?
75-79% of students have achieved math proficiency (compared to the 33% CA state average), while 75-79% of students have achieved reading proficiency (compared to the 47% CA state average).
How many students attend Academy For Enriched Sciences?
307 students attend Academy For Enriched Sciences.
What is the racial composition of the student body?
34% of Academy For Enriched Sciences students are White, 30% of students are Hispanic, 19% of students are Asian, 14% of students are Two or more races, and 3% of students are Black.
What is the student:teacher ratio of Academy For Enriched Sciences?
Academy For Enriched Sciences has a student ration of 24:1, which is higher than the California state average of 21:1.
What grades does Academy For Enriched Sciences offer ?
Academy For Enriched Sciences offers enrollment in grades Kindergarten-5
What school district is Academy For Enriched Sciences part of?
Academy For Enriched Sciences is part of Los Angeles Unified School District.
School Reviews
5 8/25/2023
The principal's dedication is second to none, the teachers are responsive and accommodating when making special requests, it's easy to be involved as a parent, they give free breakfast and the curriculum so far has been damn decent. The only downside is that they don''t get a certain type of funding from the state, or feds (I honestly forget what it's called) so to fund cool extra classes like music or robotics they rely on parents making donations-- which they do, quite a bit, and usually always meet the fundraising goals-- but be prepared to get hit up for money often. Obviously, that is easy to justify, but, they hit us up for money more than my alma mater does, and that's saying something. Monetary badgering notwithstanding, I didn't have any complaints, because, in every grade since 1st, the teachers have gotten progressively better, they''re diverse as all get out, the events they put on are cool and our daughter likes them a lot. For example, during a recent event, they hired an in-n-out catering truck to come to the event, so obviously everyone loved that. Oh, and I should state for the record that I' 'm probably the hardest to appease or impress parents in the entire district; I was raised by two San Francisco Summer of Love hippies, one of whom was a conscientious objector drafted in the Vietnam War, and the other was an alternative education conference circuit speaker, who unschooled my brother and I from K-12. She wrote several books on education and when people would come to the door and ask for money from the local school district she' 'd laugh at them and say she' 'd gladly sign something and donate if they promised to take money AWAY from the school system. That''s not a joke, either. My point is that I was not raised with the idea that schools are anything other than glorified child prisons, with very Carlin-esque undertones in believing they're only there to create good little worker bees who pump out obedient little drones who are just smart enough to do the paperwork and run the machines, but just dumb and complacent enough to passively accept the system that's rigged against their ability to think freely or prosper past a certain level. So the fact that I like and think AES is good enough to send my daughter to should speak volumes for this place. I like it, and I don''t hate it, even though I was indoctrinated to. Take that how you will!
Review Academy For Enriched Sciences. Reviews should be a few sentences in length. Please include any comments on:
- Quality of academic programs, teachers, and facilities
- Availability of music, art, sports and other extracurricular activities
Recent Articles

What Is A Charter School?
Explore the world of charter schools in this comprehensive guide. Learn about their history, how they operate, and the pros and cons of this educational innovation. Discover key facts about charter schools, including admission policies, demographics, and funding, as well as what to look for when considering a charter school for your child.

10 Reasons Why High School Sports Benefit Students
Discover the 10 compelling reasons why high school sports are beneficial for students. This comprehensive article explores how athletics enhance academic performance, foster personal growth, and develop crucial life skills. From improved fitness and time management to leadership development and community representation, learn why participating in high school sports can be a game-changer for students' overall success and well-being.

February 05, 2025
Understanding the U.S. Department of Education: Structure, Impact, and EvolutionWe explore how the Department of Education shapes American education, from its cabinet-level leadership to its impact on millions of students, written for general audiences seeking clarity on this vital institution.


