Serving 378 students in grades 6-8, Betty Reid Soskin Middle School ranks in the bottom 50% of all schools in California for overall test scores (math proficiency is bottom 50%, and reading proficiency is bottom 50%).
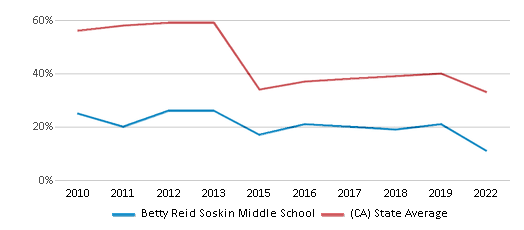
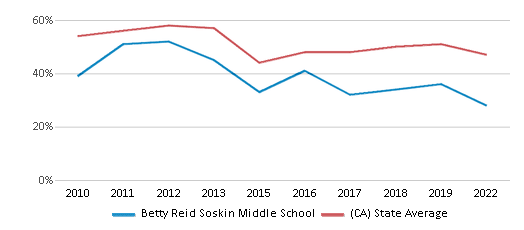
The percentage of students achieving proficiency in math is 11% (which is lower than the California state average of 33%). The percentage of students achieving proficiency in reading/language arts is 28% (which is lower than the California state average of 47%).
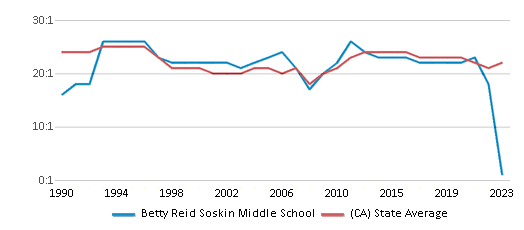
The student:teacher ratio of 19:1 is lower than the California state level of 21:1.
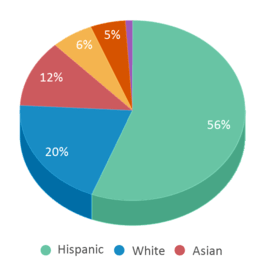
Minority enrollment is 93% of the student body (majority Hispanic), which is higher than the California state average of 80% (majority Hispanic).
Quick Stats (2025)
- Grades: 6-8
- Enrollment: 378 students
- Student:Teacher Ratio: 19:1
- Minority Enrollment: 93%
- Overall Testing Rank: Bottom 50% in CA
- Math Proficiency: 11% (Btm 50%)
- Reading Proficiency: 28% (Btm 50%)
- Science Proficiency: 10-14% (Btm 50%)
- Source: National Center for Education Statistics (NCES), CA Dept. of Education
Top Rankings
Betty Reid Soskin Middle School ranks among the top 20% of public schools in California for:
Category
Attribute
Diversity
School Overview
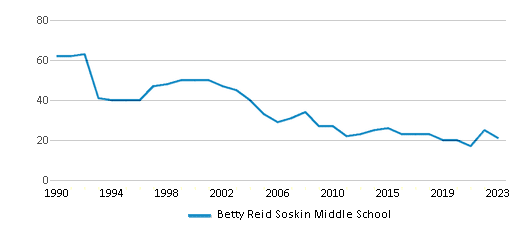
Betty Reid Soskin Middle School's student population of 378 students has declined by 15% over five school years.
The teacher population of 20 teachers has stayed relatively flat over five school years.
Grades Offered
Grades 6-8
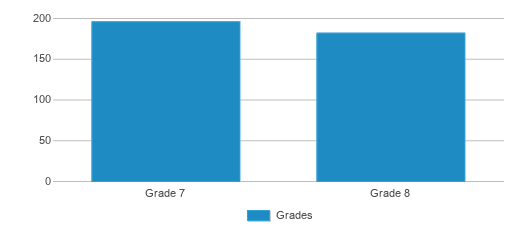
Total Students
378 students

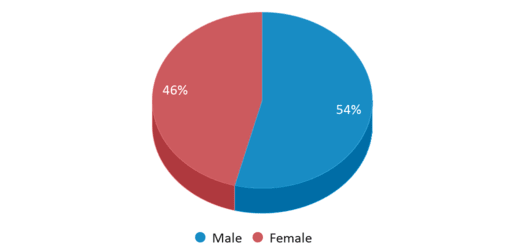
Gender %
Total Classroom Teachers
20 teachers
Students by Grade
School Rankings
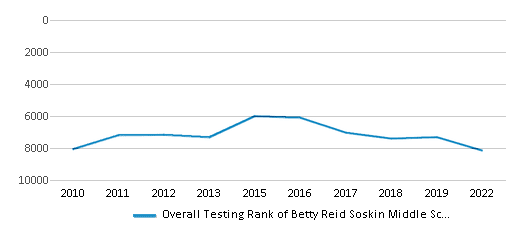
Betty Reid Soskin Middle School ranks within the bottom 50% of all 9,602 schools in California (based off of combined math and reading proficiency testing data).
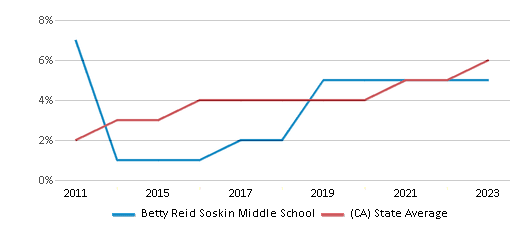
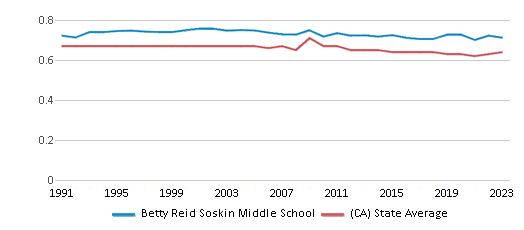
The diversity score of Betty Reid Soskin Middle School is 0.71, which is more than the diversity score at state average of 0.63. The school's diversity has stayed relatively flat over five school years.
Overall Testing Rank
#8152 out of 9602 schools
(Bottom 50%)
(Bottom 50%)
Math Test Scores (% Proficient)
11%
33%
Reading/Language Arts Test Scores (% Proficient)
28%
47%
Science Test Scores (% Proficient)
10-14%
29%
Student : Teacher Ratio
19:1
21:1
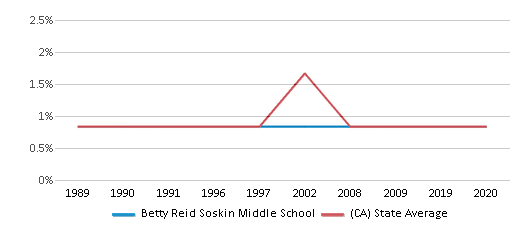
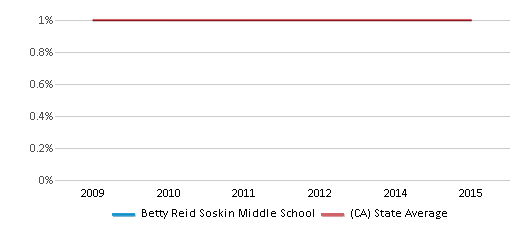
American Indian
1%
1%
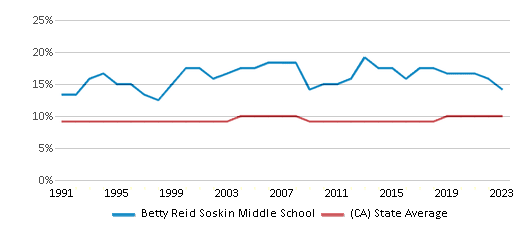
Asian
17%
12%
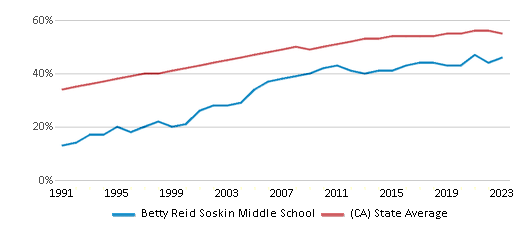
Hispanic
47%
56%
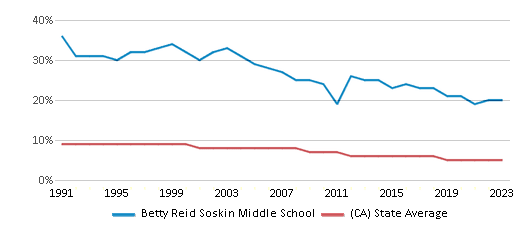
Black
20%
5%
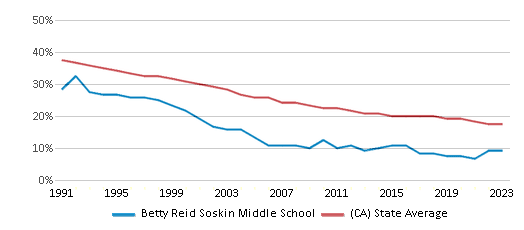
White
7%
20%
Hawaiian
1%
n/a
Two or more races
7%
6%
All Ethnic Groups
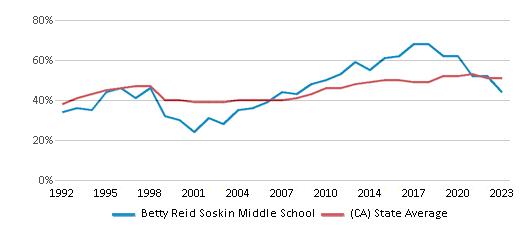
Eligible for Free Lunch
55%
54%
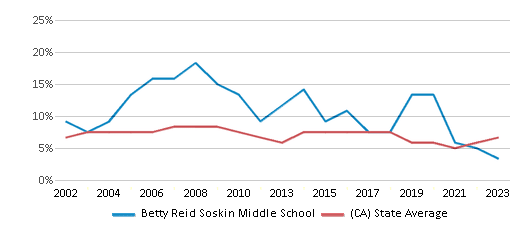
Eligible for Reduced Lunch
6%
8%
School Statewide Testing
School District Name
Source: National Center for Education Statistics (NCES), CA Dept. of Education
Profile last updated: 02/09/2025
Frequently Asked Questions
What is Betty Reid Soskin Middle School's ranking?
Betty Reid Soskin Middle School is ranked #8152 out of 9,602 schools, which ranks it among the bottom 50% of public schools in California.
What schools are Betty Reid Soskin Middle School often compared to?
Betty Reid Soskin Middle Schoolis often viewed alongside schools like Pinole Middle School by visitors of our site.
What percent of students have achieved state testing proficiency in math and reading?
11% of students have achieved math proficiency (compared to the 33% CA state average), while 28% of students have achieved reading proficiency (compared to the 47% CA state average).
How many students attend Betty Reid Soskin Middle School?
378 students attend Betty Reid Soskin Middle School.
What is the racial composition of the student body?
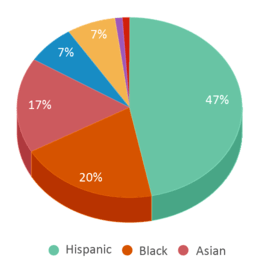
47% of Betty Reid Soskin Middle School students are Hispanic, 20% of students are Black, 17% of students are Asian, 7% of students are White, 7% of students are Two or more races, 1% of students are American Indian, and 1% of students are Hawaiian.
What is the student:teacher ratio of Betty Reid Soskin Middle School?
Betty Reid Soskin Middle School has a student ration of 19:1, which is lower than the California state average of 21:1.
What grades does Betty Reid Soskin Middle School offer ?
Betty Reid Soskin Middle School offers enrollment in grades 6-8
What school district is Betty Reid Soskin Middle School part of?
Betty Reid Soskin Middle School is part of West Contra Costa Unified School District.
School Calendar
View the Betty Reid Soskin Middle School yearly calendar below. Note key dates such as:
Event
Date
Last day of School (Noon Dismissal)
June 11, 2025 (Wednesday)
School Reviews
5 5/17/2016
I attended Juan Crespi from 2010-2012. In general, it's a mediocre school. While GATE glasses are
offered, there are no advanced math classes. The GATE classes that are offered are taught by
amazing teachers though. The only problem is the students. A lot of them are really ghetto and/or
disruptive, especially in non-advanced classes. If you go here, hope that you''re in GATE.
2 2/24/2015
I met with a counselor, about my childs grades. The counselor was far more interested in telling me about my child being tardy, than he was about the real question. I want to know what can be done to improve my childs grades and make sure he is prepared for the next grade. This counselor spoke to me as if he had no interest in my child. My main concern at this point is, if I cannot communicate with him on an adult level how can 12 and 13 year old children communicate. He does not seem to care about the children or their education. Public schools need to make counselors accountable for following up with children with low grades. He does not seem to care so; Why should the children care or have any interest in learning and understanding?
5 2/2/2015
hi its roxann parrish this is a great school I live it because I get good grades
5 5/21/2012
I was a student at Juan Crepsi from 1979-1982. I remember all my childhood friends from El Sobrante Elementary that went on the Crepsi I played the saxaphone in band.Excellent negihborhood and great transportation back then
5 7/1/2007
Crespi is a great school, the staff is outstanding. My son got very good grades and no complain whatsoever. Thanks to all the staff at Crespi!
Review Betty Reid Soskin Middle School. Reviews should be a few sentences in length. Please include any comments on:
- Quality of academic programs, teachers, and facilities
- Availability of music, art, sports and other extracurricular activities
Recent Articles

What Is A Charter School?
Explore the world of charter schools in this comprehensive guide. Learn about their history, how they operate, and the pros and cons of this educational innovation. Discover key facts about charter schools, including admission policies, demographics, and funding, as well as what to look for when considering a charter school for your child.

10 Reasons Why High School Sports Benefit Students
Discover the 10 compelling reasons why high school sports are beneficial for students. This comprehensive article explores how athletics enhance academic performance, foster personal growth, and develop crucial life skills. From improved fitness and time management to leadership development and community representation, learn why participating in high school sports can be a game-changer for students' overall success and well-being.

February 05, 2025
Understanding the U.S. Department of Education: Structure, Impact, and EvolutionWe explore how the Department of Education shapes American education, from its cabinet-level leadership to its impact on millions of students, written for general audiences seeking clarity on this vital institution.


