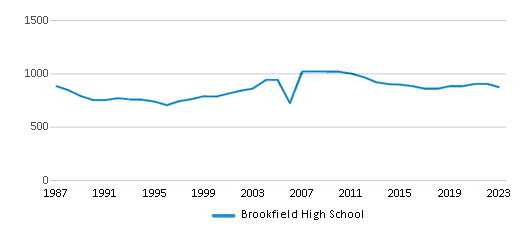
Serving 871 students in grades 9-12, Brookfield High School ranks in the top 30% of all schools in Connecticut for overall test scores (math proficiency is top 50%, and reading proficiency is top 50%).
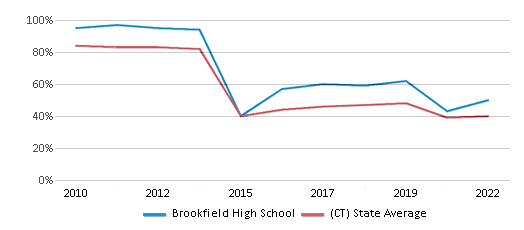
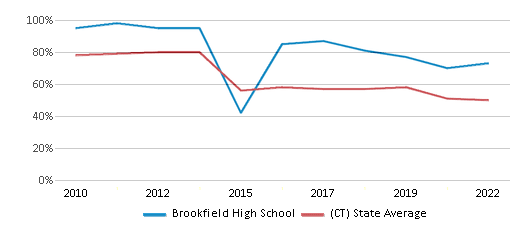
The percentage of students achieving proficiency in math is 50% (which is higher than the Connecticut state average of 40%). The percentage of students achieving proficiency in reading/language arts is 73% (which is higher than the Connecticut state average of 50%).
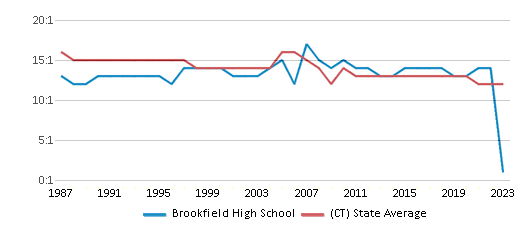
The student:teacher ratio of 13:1 is higher than the Connecticut state level of 12:1.
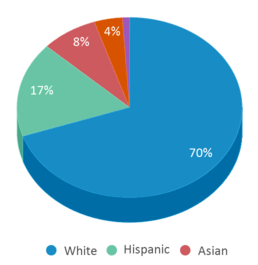
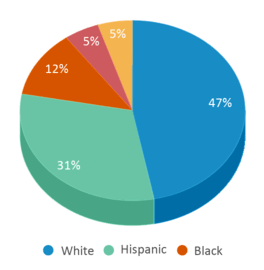
Minority enrollment is 30% of the student body (majority Hispanic), which is lower than the Connecticut state average of 53% (majority Hispanic).
Quick Stats (2025)
- Grades: 9-12
- Enrollment: 871 students
- Student:Teacher Ratio: 13:1
- Minority Enrollment: 30%
- Graduation Rate: 95% (Top 50% in CT)
- Overall Testing Rank: Top 30%
- Math Proficiency: 50% (Top 50%)
- Reading Proficiency: 73% (Top 20%)
- Science Proficiency: 58% (Top 50%)
- Source: National Center for Education Statistics (NCES), CT Dept. of Education
Top Rankings
Brookfield High School ranks among the top 20% of public schools in Connecticut for:
Category
Attribute
Reading/Language Arts Proficiency
School Overview
Brookfield High School's student population of 871 students has stayed relatively flat over five school years.
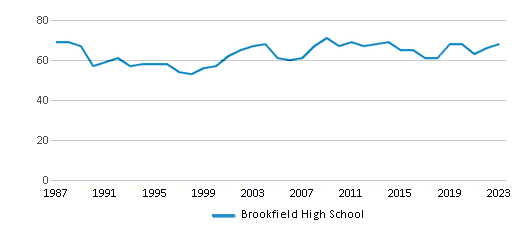
The teacher population of 67 teachers has stayed relatively flat over five school years.
Grades Offered
Grades 9-12
(offers virtual instruction)
(offers virtual instruction)
Total Students
871 students
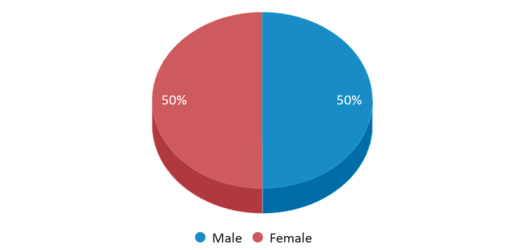
Gender %
Total Classroom Teachers
67 teachers
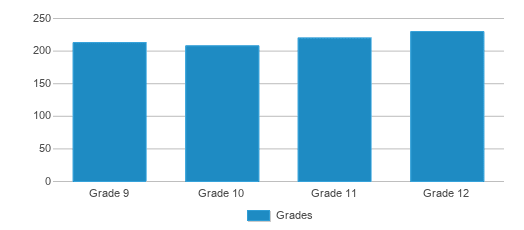
Students by Grade
School Calendar
School Rankings
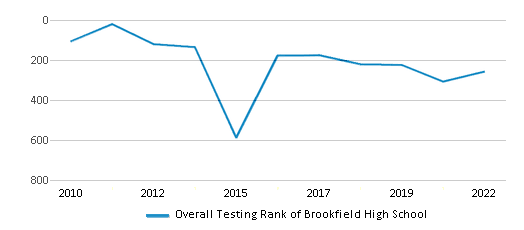
Brookfield High School ranks within the top 30% of all 942 schools in Connecticut (based off of combined math and reading proficiency testing data).
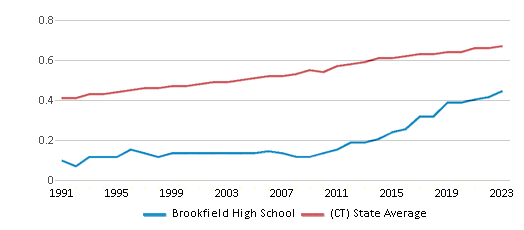
The diversity score of Brookfield High School is 0.48, which is less than the diversity score at state average of 0.68. The school's diversity has stayed relatively flat over five school years.
Overall Testing Rank
#257 out of 942 schools
(Top 30%)
(Top 30%)
Math Test Scores (% Proficient)
50%
40%
Reading/Language Arts Test Scores (% Proficient)
73%
50%
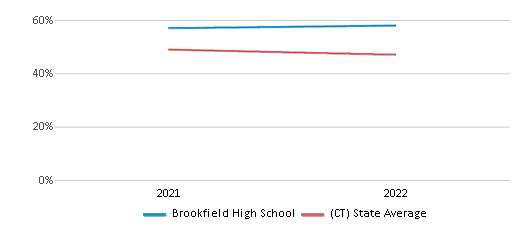
Science Test Scores (% Proficient)
58%
47%
Student : Teacher Ratio
13:1
12:1
American Indian
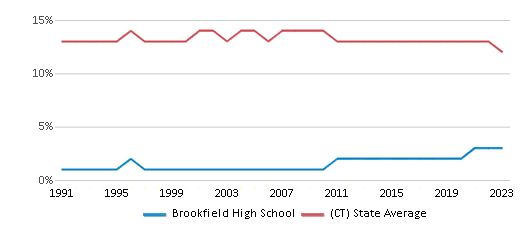
1%
n/a
Asian
8%
5%
Hispanic
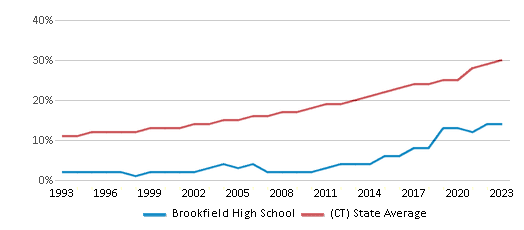
17%
31%
Black
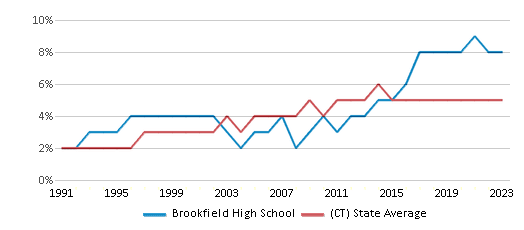
4%
12%
White
70%
47%

Hawaiian
n/a
n/a
Two or more races
n/a
5%
All Ethnic Groups
Graduation Rate
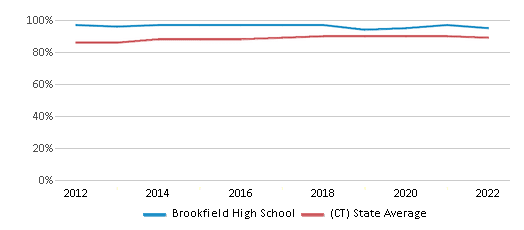
95%
89%
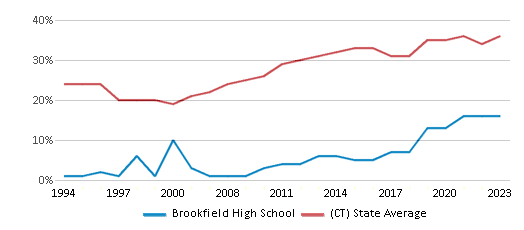
Eligible for Free Lunch
17%
37%
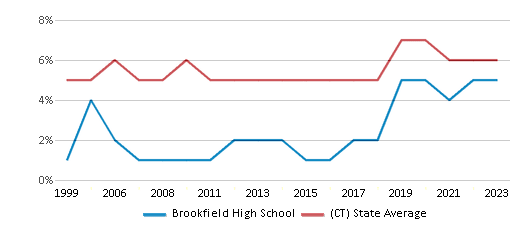
Eligible for Reduced Lunch
7%
6%
School Statewide Testing
School District Name
Source: National Center for Education Statistics (NCES), CT Dept. of Education
Profile last updated: 02/09/2025
Frequently Asked Questions
What is Brookfield High School's ranking?
Brookfield High School is ranked #257 out of 942 schools, which ranks it among the top 30% of public schools in Connecticut.
What schools are Brookfield High School often compared to?
Brookfield High Schoolis often viewed alongside schools like Bethel High School by visitors of our site.
What percent of students have achieved state testing proficiency in math and reading?
50% of students have achieved math proficiency (compared to the 40% CT state average), while 73% of students have achieved reading proficiency (compared to the 50% CT state average).
What is the graduation rate of Brookfield High School?
The graduation rate of Brookfield High School is 95%, which is higher than the Connecticut state average of 89%.
How many students attend Brookfield High School?
871 students attend Brookfield High School.
What is the racial composition of the student body?
70% of Brookfield High School students are White, 17% of students are Hispanic, 8% of students are Asian, 4% of students are Black, and 1% of students are American Indian.
What is the student:teacher ratio of Brookfield High School?
Brookfield High School has a student ration of 13:1, which is higher than the Connecticut state average of 12:1.
What grades does Brookfield High School offer ?
Brookfield High School offers enrollment in grades 9-12 (offers virtual instruction).
What school district is Brookfield High School part of?
Brookfield High School is part of Brookfield School District.
School Reviews
5 4/28/2021
The negative reviews here lack details and the one positive review rates the school a 4 out of 5 for no apparent reason. The school merits better. I am a JR at BHS and I have not had a bad teacher since I started here. I am in all honors and AP courses, and my teachers are smart, knowledgeable about their subjects, and they push us to do good work. There is a fair amount of homework, but that's true for any set of advanced courses. As for the students, people have their own friend groups, but I haven't ever witnessed any bullying. Nobody is shoving anyone into lockers or torturing freshmen. In terms of college readiness, I think I am ready and well prepared to take my AP exams and I think that I will be ready and well prepared for college after next year. I am also a three-sport athlete. My coaches are all great. They are also supportive and encouraging even as they push us to win. My peers seem pretty happy even if all of us are a bit stressed because of all the COVID restrictions and mask-wearing, and people are just nice to each other in general here. All in all, BHS is a very, very good high school. There are plenty of opportunities for learning and engagement if you want them, there are plenty of sports teams and clubs to join, and the social environment is as good as any you'd find in any high school. BHS deserves 5 stars, so 5 stars it is.
4 10/9/2020
I have sent my three boys mostly to private school, but my youngest is now attending BHS. It is a fantastic school. The teachers have been outstanding, and there are a plethora of options for coursework. My son is taking 5 AP classes as a junior and is likely to take 5 more than a senior. That's not an option at many schools. His coaches have also been terrific. The coursework is rigorous and thoughtful; the teachers are knowledgeable (okay, and demanding), and these kids are very ready for college. On the road where I live there are 10 BHS graduates, all of whom graduated from the school over the past four years and all of whom were well prepared for college and excelled or are excelling in college. In comparison with my children's experience at their private schools, there is really no contest, BHS is definitely as good or better in every respect. This is now my third time as a high school parent, and out of all the schools my kids have attended, I genuinely think that BHS is the best. Contrary to the other reviewers'' experiences, I would give high marks to the administration. Counselors are thoughtful and attentive and the administration communicates with the parent body. I'm a huge fan of this school.
1 3/27/2020
This school has seriously gone down hill since Balanda was made principal this school did not prepare me for college in any way and something needs to be done. Blender is soft.
2 12/28/2015
The HS has serious issues as things have gotten worse over the years. Too many things to list as the place has become a tremendous dissapointment. We had to pull our kid out and send her to private school.
Review Brookfield High School. Reviews should be a few sentences in length. Please include any comments on:
- Quality of academic programs, teachers, and facilities
- Availability of music, art, sports and other extracurricular activities
Recent Articles

What Is A Charter School?
Explore the world of charter schools in this comprehensive guide. Learn about their history, how they operate, and the pros and cons of this educational innovation. Discover key facts about charter schools, including admission policies, demographics, and funding, as well as what to look for when considering a charter school for your child.

10 Reasons Why High School Sports Benefit Students
Discover the 10 compelling reasons why high school sports are beneficial for students. This comprehensive article explores how athletics enhance academic performance, foster personal growth, and develop crucial life skills. From improved fitness and time management to leadership development and community representation, learn why participating in high school sports can be a game-changer for students' overall success and well-being.

February 05, 2025
Understanding the U.S. Department of Education: Structure, Impact, and EvolutionWe explore how the Department of Education shapes American education, from its cabinet-level leadership to its impact on millions of students, written for general audiences seeking clarity on this vital institution.


