For the 2025 school year, there is 1 public school serving 500 students in Multicultural Learning Center School District. This district's average testing ranking is 3/10, which is in the bottom 50% of public schools in California.
Public School in Multicultural Learning Center School District have an average math proficiency score of 19% (versus the California public school average of 33%), and reading proficiency score of 33% (versus the 47% statewide average).
Minority enrollment is 96% of the student body (majority Hispanic), which is more than the California public school average of 80% (majority Hispanic).
Overview
This School District
This State (CA)
# Schools
1 School
10,369 Schools
# Students
500 Students
5,826,838 Students
# Teachers
22 Teachers
268,012 Teachers
Student : Teacher Ratio
23:1
23:1
District Rank
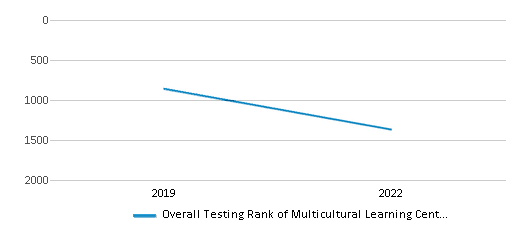
Multicultural Learning Center School District, which is ranked #1364 of all 1,925 school districts in California (based off of combined math and reading proficiency testing data) for the 2021-2022 school year.
Overall District Rank
#1367 out of 1941 school districts
(Bottom 50%)
(Bottom 50%)
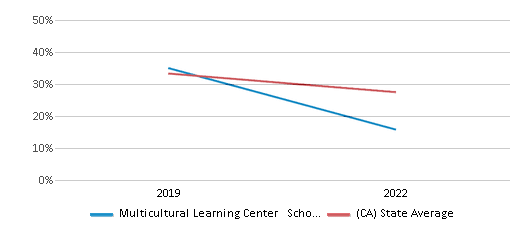
Math Test Scores (% Proficient)
19%
33%
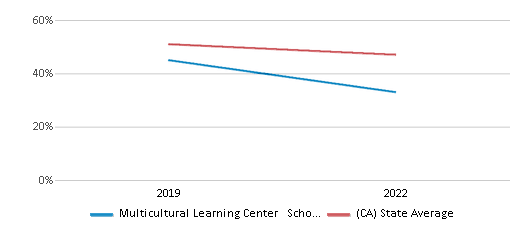
Reading/Language Arts Test Scores (% Proficient)
33%
47%
Science Test Scores (% Proficient)
15-19%
29%
Students by Ethnicity:
Diversity Score
0.28
0.63
# American Indian Students
3 Students
25,796 Students
% American Indian Students
1%
1%
# Asian Students
4 Students
705,807 Students
% Asian Students
1%
12%
# Hispanic Students
422 Students
3,264,561 Students
% Hispanic Students
84%
56%
# Black Students
13 Students
286,112 Students
% Black Students
3%
5%
# White Students
22 Students
1,178,558 Students
% White Students
4%
20%
# Hawaiian Students
n/a
23,731 Students
% Hawaiian Students
n/a
n/a
# Two or more races Students
36 Students
333,755 Students
% of Two or more races Students
7%
6%
Students by Grade:
# Students in PK Grade:
-
83
# Students in K Grade:
80
522,456
# Students in 1st Grade:
66
396,605
# Students in 2nd Grade:
58
414,466
# Students in 3rd Grade:
66
416,628
# Students in 4th Grade:
42
426,361
# Students in 5th Grade:
62
430,587
# Students in 6th Grade:
38
432,997
# Students in 7th Grade:
53
439,621
# Students in 8th Grade:
35
441,777
# Students in 9th Grade:
-
466,534
# Students in 10th Grade:
-
476,585
# Students in 11th Grade:
-
469,511
# Students in 12th Grade:
-
492,627
# Ungraded Students:
-
-
District Revenue and Spending
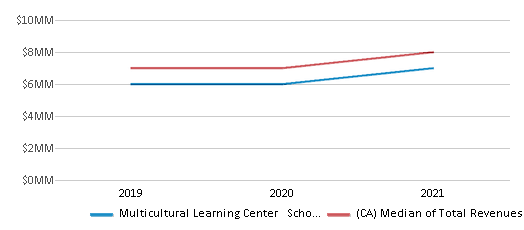
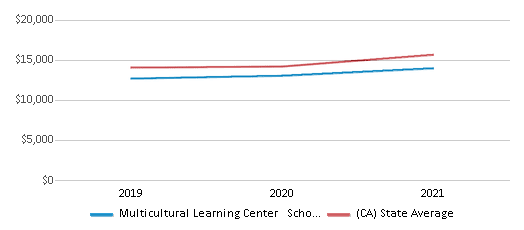
The revenue/student of $13,416 in this school district is less than the state median of $19,974. The school district revenue/student has stayed relatively flat over four school years.
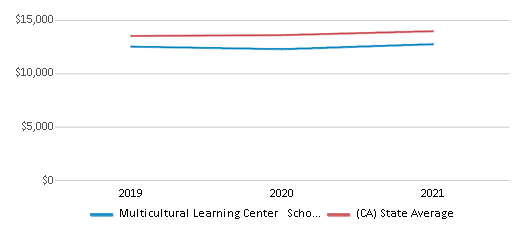
The school district's spending/student of $12,242 is less than the state median of $18,396. The school district spending/student has stayed relatively flat over four school years.
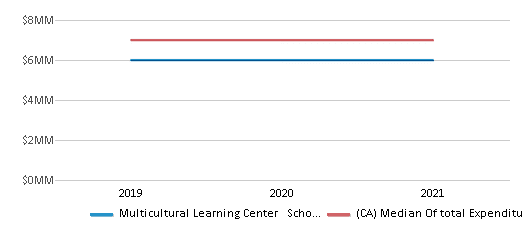
Total Revenue
$7 MM
$116,387 MM
Spending
$6 MM
$107,188 MM
Revenue / Student
$13,416
$19,974
Spending / Student
$12,242
$18,396
Best Multicultural Learning Center School District Public Schools (2025)
School
(Math and Reading Proficiency)
(Math and Reading Proficiency)
Location
Grades
Students
Rank: #11.
Multicultural Learning Center
Charter School
(Math: 19% | Reading: 33%)
Rank:
Rank:
4/
Bottom 50%10
7510 Desoto Ave.
Canoga Park, CA 91303
(818) 716-5783
Canoga Park, CA 91303
(818) 716-5783
Grades: K-8
| 500 students
Frequently Asked Questions
How many schools belong to Multicultural Learning Center School District?
Multicultural Learning Center School District manages 1 public schools serving 500 students.
What is the rank of Multicultural Learning Center School District?
Multicultural Learning Center School District is ranked #1364 out of 1,925 school districts in California (bottom 50%) based off of combined math and reading proficiency testing data for the 2021-2022 school year.
What is the racial composition of students in Multicultural Learning Center School District?
84% of Multicultural Learning Center School District students are Hispanic, 7% of students are Two or more races, 4% of students are White, 3% of students are Black, 1% of students are American Indian, and 1% of students are Asian.
What is the student/teacher ratio of Multicultural Learning Center School District?
Multicultural Learning Center School District has a student/teacher ratio of 23:1, which is higher than the California state average of 22:1.
What is Multicultural Learning Center School District's spending/student ratio?
The school district's spending/student of $12,242 is less than the state median of $18,396. The school district spending/student has stayed relatively flat over four school years.
Recent Articles

Sexual Harassment at Age 6: The Tale of a First Grade Suspension
A six-year old in Aurora, Colorado, was suspended after singing an LMFAO song to a little girl in his class and reportedly “shaking his booty.” We look at the case and the sexual harassment problem in public schools today.

How Scaffolding Could Change the Way Your Child Learns
This article explores the concept of instructional scaffolding, a teaching method that enhances learning by breaking down complex tasks into manageable parts. It highlights how scaffolding supports students in developing critical thinking skills and becoming more independent learners. The article discusses the benefits of scaffolding, including improved engagement and reduced anxiety, and provides strategies for its implementation across various educational levels.

February 05, 2025
Understanding the U.S. Department of Education: Structure, Impact, and EvolutionWe explore how the Department of Education shapes American education, from its cabinet-level leadership to its impact on millions of students, written for general audiences seeking clarity on this vital institution.


