For the 2025 school year, there is 1 public school serving 504 students in Opportunities For Learning - William S. Hart School District. This district's average testing ranking is 4/10, which is in the bottom 50% of public schools in California.
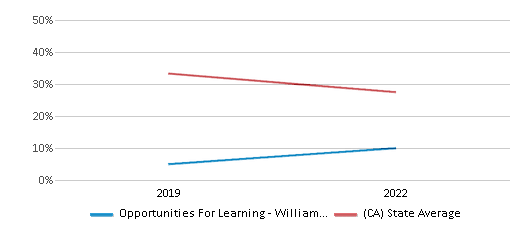
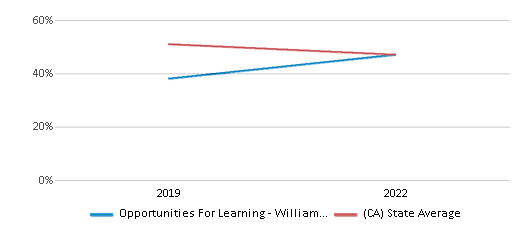
Public School in Opportunities For Learning - William S. Hart School District have an average math proficiency score of 12% (versus the California public school average of 33%), and reading proficiency score of 47% (versus the 47% statewide average).
Minority enrollment is 66% of the student body (majority Hispanic), which is less than the California public school average of 80% (majority Hispanic).
Overview
This School District
This State (CA)
# Schools
1 School
10,369 Schools
# Students
504 Students
5,826,838 Students
# Teachers
21 Teachers
268,012 Teachers
Student : Teacher Ratio
24:1
24:1
District Rank
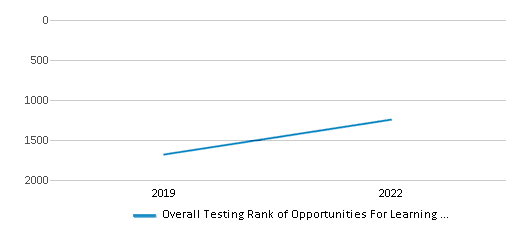
Opportunities For Learning - William S. Hart School District, which is ranked #1245 of all 1,925 school districts in California (based off of combined math and reading proficiency testing data) for the 2021-2022 school year.
The school district's graduation rate of 45-49% has stayed relatively flat over five school years.
Overall District Rank
#1243 out of 1941 school districts
(Bottom 50%)
(Bottom 50%)
Math Test Scores (% Proficient)
10-14%
33%
Reading/Language Arts Test Scores (% Proficient)
45-49%
47%
Science Test Scores (% Proficient)
25-29%
29%
Graduation Rate
45-49%
87%
Students by Ethnicity:
Diversity Score
0.63
0.63
# American Indian Students
2 Students
25,796 Students
% American Indian Students
1%
1%
# Asian Students
9 Students
705,807 Students
% Asian Students
2%
12%
# Hispanic Students
254 Students
3,264,561 Students
% Hispanic Students
51%
56%
# Black Students
13 Students
286,112 Students
% Black Students
3%
5%
# White Students
171 Students
1,178,558 Students
% White Students
34%
20%
# Hawaiian Students
4 Students
23,731 Students
% Hawaiian Students
1%
n/a
# Two or more races Students
40 Students
333,755 Students
% of Two or more races Students
8%
6%
Students by Grade:
# Students in PK Grade:
-
83
# Students in K Grade:
-
522,456
# Students in 1st Grade:
-
396,605
# Students in 2nd Grade:
-
414,466
# Students in 3rd Grade:
-
416,628
# Students in 4th Grade:
-
426,361
# Students in 5th Grade:
-
430,587
# Students in 6th Grade:
-
432,997
# Students in 7th Grade:
28
439,621
# Students in 8th Grade:
33
441,777
# Students in 9th Grade:
116
466,534
# Students in 10th Grade:
136
476,585
# Students in 11th Grade:
118
469,511
# Students in 12th Grade:
73
492,627
# Ungraded Students:
-
-
District Revenue and Spending
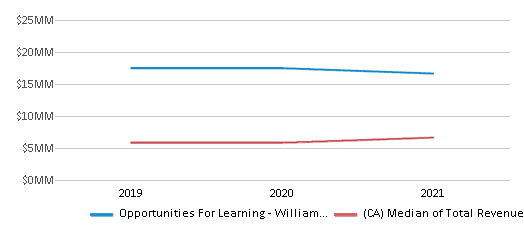
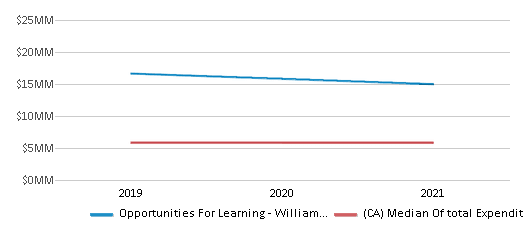
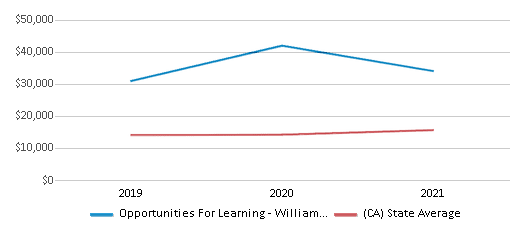
The revenue/student of $39,968 is higher than the state median of $19,974. The school district revenue/student has grown by 17% over four school years.
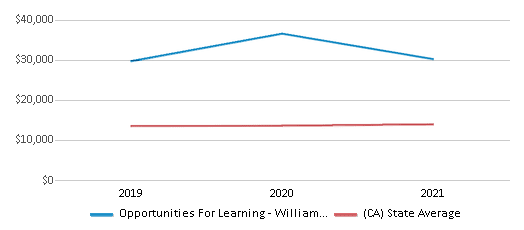
The school district's spending/student of $35,478 is higher than the state median of $18,396. The school district spending/student has grown by 17% over four school years.
Total Revenue
$20 MM
$116,387 MM
Spending
$18 MM
$107,188 MM
Revenue / Student
$39,968
$19,974
Spending / Student
$35,478
$18,396
Best Opportunities For Learning - William S. Hart School District Public Schools (2025)
School
(Math and Reading Proficiency)
(Math and Reading Proficiency)
Location
Grades
Students
Rank: #11.
Opportunities For Learning - William S. Hart
Charter School
(Math: 10-14% | Reading: 45-49%)
Rank:
Rank:
4/
Bottom 50%10
27616 Newhall Ranch Rd.
Covina, CA 91723
(661) 607-0153
Covina, CA 91723
(661) 607-0153
Grades: 7-12
| 504 students
Frequently Asked Questions
How many schools belong to Opportunities For Learning - William S. Hart School District?
Opportunities For Learning - William S. Hart School District manages 1 public schools serving 504 students.
What is the rank of Opportunities For Learning - William S. Hart School District?
Opportunities For Learning - William S. Hart School District is ranked #1245 out of 1,925 school districts in California (bottom 50%) based off of combined math and reading proficiency testing data for the 2021-2022 school year.
What is the racial composition of students in Opportunities For Learning - William S. Hart School District?
51% of Opportunities For Learning - William S. Hart School District students are Hispanic, 34% of students are White, 8% of students are Two or more races, 3% of students are Black, 2% of students are Asian, 1% of students are American Indian, and 1% of students are Hawaiian.
What is the student/teacher ratio of Opportunities For Learning - William S. Hart School District?
Opportunities For Learning - William S. Hart School District has a student/teacher ratio of 24:1, which is higher than the California state average of 22:1.
What is Opportunities For Learning - William S. Hart School District's spending/student ratio?
The school district's spending/student of $35,478 is higher than the state median of $18,396. The school district spending/student has grown by 17% over four school years.
Recent Articles

What Is A Charter School?
Explore the world of charter schools in this comprehensive guide. Learn about their history, how they operate, and the pros and cons of this educational innovation. Discover key facts about charter schools, including admission policies, demographics, and funding, as well as what to look for when considering a charter school for your child.

10 Reasons Why High School Sports Benefit Students
Discover the 10 compelling reasons why high school sports are beneficial for students. This comprehensive article explores how athletics enhance academic performance, foster personal growth, and develop crucial life skills. From improved fitness and time management to leadership development and community representation, learn why participating in high school sports can be a game-changer for students' overall success and well-being.

February 05, 2025
Understanding the U.S. Department of Education: Structure, Impact, and EvolutionWe explore how the Department of Education shapes American education, from its cabinet-level leadership to its impact on millions of students, written for general audiences seeking clarity on this vital institution.


