Top Rankings
San Antonio Union Elementary School District ranks among the top 20% of public school district in California for:
Category
Attribute
Student Attention
Lowest student:teacher ratio (Top 1%)
For the 2025 school year, there is 1 public middle school serving 144 students in San Antonio Union Elementary School District. This district's average middle testing ranking is 3/10, which is in the bottom 50% of public middle schools in California.
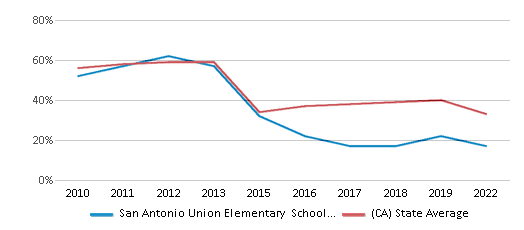
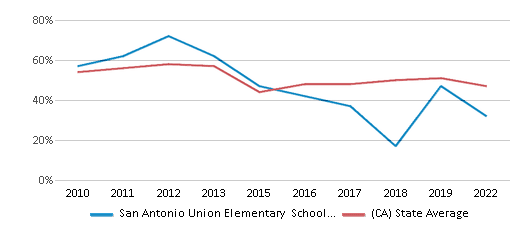
Public Middle School in San Antonio Union Elementary School District have an average math proficiency score of 17% (versus the California public middle school average of 31%), and reading proficiency score of 32% (versus the 46% statewide average).
Minority enrollment is 61% of the student body (majority Hispanic), which is less than the California public middle school average of 78% (majority Hispanic).
Overview
This School District
This State (CA)
# Schools
1 School
3,501 Schools
# Students
144 Students
1,854,363 Students
# Teachers
9 Teachers
87,821 Teachers
Student : Teacher Ratio
16:1
16:1
District Rank
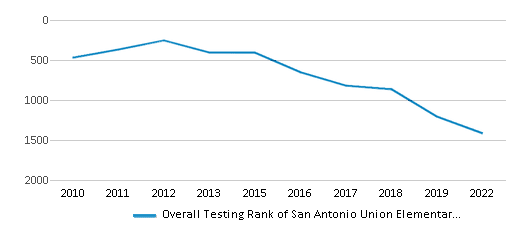
San Antonio Union Elementary School District, which is ranked #1425 of all 1,925 school districts in California (based off of combined math and reading proficiency testing data) for the 2021-2022 school year.
Overall District Rank
#1415 out of 1941 school districts
(Bottom 50%)
(Bottom 50%)
Math Test Scores (% Proficient)
15-19%
33%
Reading/Language Arts Test Scores (% Proficient)
30-34%
47%
Science Test Scores (% Proficient)
20-29%
29%
Students by Ethnicity:
Diversity Score
0.62
0.64
# American Indian Students
n/a
9,887 Students
% American Indian Students
n/a
1%
# Asian Students
2 Students
201,760 Students
% Asian Students
1%
11%
# Hispanic Students
68 Students
1,009,980 Students
% Hispanic Students
47%
55%
# Black Students
3 Students
97,908 Students
% Black Students
2%
5%
# White Students
56 Students
413,325 Students
% White Students
39%
22%
# Hawaiian Students
n/a
7,600 Students
% Hawaiian Students
n/a
n/a
# Two or more races Students
15 Students
109,003 Students
% of Two or more races Students
11%
6%
Students by Grade:
# Students in PK Grade:
-
83
# Students in K Grade:
16
90,358
# Students in 1st Grade:
11
70,728
# Students in 2nd Grade:
18
73,359
# Students in 3rd Grade:
14
73,090
# Students in 4th Grade:
18
76,068
# Students in 5th Grade:
22
82,191
# Students in 6th Grade:
14
289,122
# Students in 7th Grade:
16
439,549
# Students in 8th Grade:
15
441,705
# Students in 9th Grade:
-
59,696
# Students in 10th Grade:
-
51,846
# Students in 11th Grade:
-
51,149
# Students in 12th Grade:
-
55,419
# Ungraded Students:
-
-
District Revenue and Spending
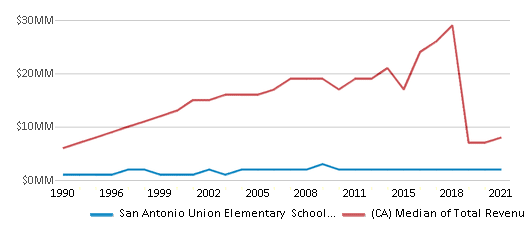
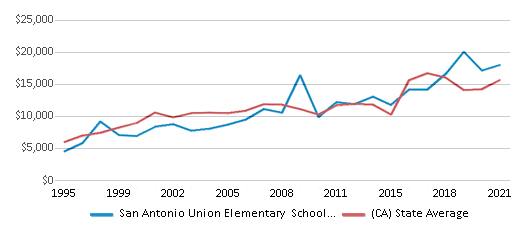
The revenue/student of $15,007 in this school district is less than the state median of $19,974. The school district revenue/student has declined by 16% over four school years.
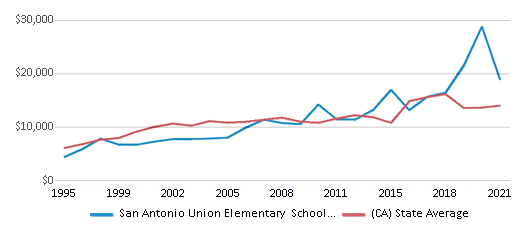
The school district's spending/student of $15,688 is less than the state median of $18,396. The school district spending/student has declined by 16% over four school years.
Total Revenue
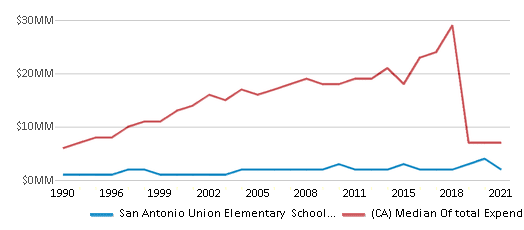
$2 MM
$116,387 MM
Spending
$2 MM
$107,188 MM
Revenue / Student
$15,007
$19,974
Spending / Student
$15,688
$18,396
Best San Antonio Union Elementary School District Public Middle Schools (2025)
School
(Math and Reading Proficiency)
(Math and Reading Proficiency)
Location
Grades
Students
Rank: #11.
San Antonio Elementary School
(Math: 15-19% | Reading: 30-34%)
Rank:
Rank:
3/
Bottom 50%10
67550 Lockwood/jolon Rd.
Lockwood, CA 93932
(831) 385-3051
Lockwood, CA 93932
(831) 385-3051
Grades: K-8
| 144 students
Recent Articles

Chicago Schools: Discipline & Fines
The latest effort in Chicago schools to discipline student by administering monetary fines for breaking rules is highly controversial, and we’ll analyze both sides of the issue.

Charter Schools Produce More Graduates than Public Schools
Studies show that graduation rates at charter schools outpace graduation rates at public schools. Learn how charter schools have been able to improve graduation rates, and the positive effects charter schools have on students’ lives in the long-term.

Changing Demographics Will Alter the Diversity of Public Schools
Uncover the projected changes in enrollment among diverse ethnic groups and the challenges state education systems face in meeting growing financial demands amidst increasing enrollment


