Serving 843 students in grades 7-8, Clarke N. Johnsen Jr High School ranks in the bottom 50% of all schools in Utah for overall test scores (math proficiency is top 50%, and reading proficiency is top 50%).
The percentage of students achieving proficiency in math is 40% (which is higher than the Utah state average of 39%). The percentage of students achieving proficiency in reading/language arts is 41% (which is lower than the Utah state average of 43%).
The student:teacher ratio of 21:1 is equal to the Utah state level of 21:1.
Minority enrollment is 26% of the student body (majority Hispanic), which is lower than the Utah state average of 29% (majority Hispanic).
Quick Stats (2025)
- Grades: 7-8
- Enrollment: 843 students
- Student:Teacher Ratio: 21:1
- Minority Enrollment: 26%
- Overall Testing Rank: Bottom 50% in UT
- Math Proficiency: 40% (Top 50%)
- Reading Proficiency: 41% (Btm 50%)
- Science Proficiency: 55% (Top 30%)
- Source: National Center for Education Statistics (NCES), UT Dept. of Education
School Overview
Clarke N. Johnsen Jr High School's student population of 843 students has stayed relatively flat over five school years.
The teacher population of 40 teachers has grown by 5% over five school years.
Grades Offered
Grades 7-8
Total Students
843 students
![This chart displays total students of Clarke N. Johnsen Jr High School by year, with the latest 2022-23 school year data. This chart displays total students of Clarke N. Johnsen Jr High School by year, with the latest 2022-23 school year data.](http://images2.publicschoolreview.com/charts/total_students/135000/134788/clarke-n-johnsen-jr-high-school-chart-bim472o.png)
Gender %
![This chart displays gender of Clarke N. Johnsen Jr High School This chart displays gender of Clarke N. Johnsen Jr High School](http://images2.publicschoolreview.com/charts/gender/135000/134788/clarke-n-johnsen-jr-high-school-chart-b4YgVKu.png)
Total Classroom Teachers
40 teachers
![This chart displays the total teachers of Clarke N. Johnsen Jr High School by year, with the latest 2022-23 school year data. This chart displays the total teachers of Clarke N. Johnsen Jr High School by year, with the latest 2022-23 school year data.](http://images2.publicschoolreview.com/charts/total_teachers/135000/134788/clarke-n-johnsen-jr-high-school-chart-bgsRkLo.png)
Students by Grade
![This chart displays the students of Clarke N. Johnsen Jr High School by grade. This chart displays the students of Clarke N. Johnsen Jr High School by grade.](http://images2.publicschoolreview.com/charts/students_by_grade/135000/134788/clarke-n-johnsen-jr-high-school-chart-beznOfW.png)
School Rankings
Clarke N. Johnsen Jr High School ranks within the bottom 50% of all 975 schools in Utah (based off of combined math and reading proficiency testing data).
The diversity score of Clarke N. Johnsen Jr High School is 0.42, which is less than the diversity score at state average of 0.46. The school's diversity has stayed relatively flat over five school years.
Overall Testing Rank
#517 out of 975 schools
(Bottom 50%)
(Bottom 50%)
![This chart displays the overall school rank of Clarke N. Johnsen Jr High School, with the latest 2021-22 school year data. This chart displays the overall school rank of Clarke N. Johnsen Jr High School, with the latest 2021-22 school year data.](http://images2.publicschoolreview.com/charts/overall_school_rank/135000/134788/clarke-n-johnsen-jr-high-school-chart-wLCyoA.png)
Math Test Scores (% Proficient)
(20-21)40%
39%
![This chart displays the percentage of students that scored at or above 'proficient' levels in Math of Clarke N. Johnsen Jr High School and the percentage of public school students that scored at or above 'proficient' levels in Math of public schools in Utah by year, with the latest 2020-21 school year data. This chart displays the percentage of students that scored at or above 'proficient' levels in Math of Clarke N. Johnsen Jr High School and the percentage of public school students that scored at or above 'proficient' levels in Math of public schools in Utah by year, with the latest 2020-21 school year data.](http://images2.publicschoolreview.com/charts/math_percent/135000/134788/clarke-n-johnsen-jr-high-school-chart-j4kP1A.png)
Reading/Language Arts Test Scores (% Proficient)
(20-21)41%
43%
![This chart displays the percentage of students that scored at or above 'proficient' levels in Reading/Language Arts of Clarke N. Johnsen Jr High School and the percentage of public school students that scored at or above 'proficient' levels in Reading/Language Arts of Utah by year, with the latest 2020-21 school year data. This chart displays the percentage of students that scored at or above 'proficient' levels in Reading/Language Arts of Clarke N. Johnsen Jr High School and the percentage of public school students that scored at or above 'proficient' levels in Reading/Language Arts of Utah by year, with the latest 2020-21 school year data.](http://images2.publicschoolreview.com/charts/rla_percent/135000/134788/clarke-n-johnsen-jr-high-school-chart-bgsRkLK.png)
Science Test Scores (% Proficient)
(20-21)55%
45%
Student : Teacher Ratio
21:1
21:1
![This chart displays the student teacher ratio of Clarke N. Johnsen Jr High School and the public school average student teacher ratio of Utah by year, with the latest 2022-23 school year data. This chart displays the student teacher ratio of Clarke N. Johnsen Jr High School and the public school average student teacher ratio of Utah by year, with the latest 2022-23 school year data.](http://images2.publicschoolreview.com/charts/teacher_student_ratio/135000/134788/clarke-n-johnsen-jr-high-school-chart-TbzBYD.png)
American Indian
n/a
1%
![This chart displays the percentage of American Indian students in Clarke N. Johnsen Jr High School and percentage of American Indian public school students in Utah by year, with the latest 2022-23 school year data. This chart displays the percentage of American Indian students in Clarke N. Johnsen Jr High School and percentage of American Indian public school students in Utah by year, with the latest 2022-23 school year data.](http://images2.publicschoolreview.com/charts/american_indian_ethnicity/135000/134788/clarke-n-johnsen-jr-high-school-chart-FJYdiZ.png)
Asian
1%
2%
![This chart displays the percentage of Asian students in Clarke N. Johnsen Jr High School and the percentage of Asian public school students in Utah by year, with the latest 2022-23 school year data. This chart displays the percentage of Asian students in Clarke N. Johnsen Jr High School and the percentage of Asian public school students in Utah by year, with the latest 2022-23 school year data.](http://images2.publicschoolreview.com/charts/asian_islander_ethnicity/135000/134788/clarke-n-johnsen-jr-high-school-chart-bpNcapL.png)
Hispanic
18%
20%
![This chart displays the percentage of Hispanic students in Clarke N. Johnsen Jr High School and the percentage of Hispanic public school students in Utah by year, with the latest 2022-23 school year data. This chart displays the percentage of Hispanic students in Clarke N. Johnsen Jr High School and the percentage of Hispanic public school students in Utah by year, with the latest 2022-23 school year data.](http://images2.publicschoolreview.com/charts/hispanic_students_ethnicity/135000/134788/clarke-n-johnsen-jr-high-school-chart-fGUgcY.png)
Black
1%
1%
![This chart displays the percentage of Black students in Clarke N. Johnsen Jr High School and the percentage of Black public school students in Utah by year, with the latest 2022-23 school year data. This chart displays the percentage of Black students in Clarke N. Johnsen Jr High School and the percentage of Black public school students in Utah by year, with the latest 2022-23 school year data.](http://images2.publicschoolreview.com/charts/black_students_ethnicity/135000/134788/clarke-n-johnsen-jr-high-school-chart-pleV4X.png)
White
74%
71%
![This chart displays the percentage of White students in Clarke N. Johnsen Jr High School and the percentage of White public school students in Utah by year, with the latest 2022-23 school year data. This chart displays the percentage of White students in Clarke N. Johnsen Jr High School and the percentage of White public school students in Utah by year, with the latest 2022-23 school year data.](http://images2.publicschoolreview.com/charts/white_students_ethnicity/135000/134788/clarke-n-johnsen-jr-high-school-chart-RhMpr7.png)
Hawaiian
3%
1%
![This chart displays the percentage of Hawaiian students in Clarke N. Johnsen Jr High School and the percentage of Hawaiian public school students in Utah by year, with the latest 2022-23 school year data. This chart displays the percentage of Hawaiian students in Clarke N. Johnsen Jr High School and the percentage of Hawaiian public school students in Utah by year, with the latest 2022-23 school year data.](http://images2.publicschoolreview.com/charts/hawaiian_students_ethnicity/135000/134788/clarke-n-johnsen-jr-high-school-chart-pleV5f.png)
Two or more races
3%
4%
![This chart displays the percentage of students of two or more races in Clarke N. Johnsen Jr High School and the percentage of public school students of two or more races in Utah by year, with the latest 2022-23 school year data. This chart displays the percentage of students of two or more races in Clarke N. Johnsen Jr High School and the percentage of public school students of two or more races in Utah by year, with the latest 2022-23 school year data.](http://images2.publicschoolreview.com/charts/two_or_more_races_students_ethnicity/135000/134788/clarke-n-johnsen-jr-high-school-chart-WOGvwt.png)
All Ethnic Groups
![This chart displays the percentage breakdown of students of all ethnic groups in Clarke N. Johnsen Jr High School. This chart displays the percentage breakdown of students of all ethnic groups in Clarke N. Johnsen Jr High School.](http://images2.publicschoolreview.com/charts/school_ethnicity/135000/134788/clarke-n-johnsen-jr-high-school-chart-b1kQmz1.png)
![This chart displays the percentage breakdown of public school students of all ethnic groups in Utah. This chart displays the percentage breakdown of public school students of all ethnic groups in Utah.](http://images2.publicschoolreview.com/charts/state_ethnicity_school/135000/134788/clarke-n-johnsen-jr-high-school-chart-6pNnIW.png)
![This chart displays the diversity score of Clarke N. Johnsen Jr High School and the public school average diversity score of Utah by year, with the latest 2022-23 school year data. This chart displays the diversity score of Clarke N. Johnsen Jr High School and the public school average diversity score of Utah by year, with the latest 2022-23 school year data.](http://images2.publicschoolreview.com/charts/diversity_score/135000/134788/clarke-n-johnsen-jr-high-school-chart-lxOmhn.png)
Eligible for Free Lunch
19%
24%
![This chart displays the percentage of students who is eligible for free lunch in Clarke N. Johnsen Jr High School and the percentage of public school students who is eligible for free lunch in Utah by year, with the latest 2022-23 school year data. This chart displays the percentage of students who is eligible for free lunch in Clarke N. Johnsen Jr High School and the percentage of public school students who is eligible for free lunch in Utah by year, with the latest 2022-23 school year data.](http://images2.publicschoolreview.com/charts/freelunch_students/135000/134788/clarke-n-johnsen-jr-high-school-chart-sYvET2.png)
Eligible for Reduced Lunch
6%
6%
![This chart displays the percentage of students who is eligible for reduced lunch in Clarke N. Johnsen Jr High School and the percentage of public school students who is eligible for reduced lunch in Utah by year, with the latest 2022-23 school year data. This chart displays the percentage of students who is eligible for reduced lunch in Clarke N. Johnsen Jr High School and the percentage of public school students who is eligible for reduced lunch in Utah by year, with the latest 2022-23 school year data.](http://images2.publicschoolreview.com/charts/reduced_pricelunch_students/135000/134788/clarke-n-johnsen-jr-high-school-chart-Nu55UO.png)
School Statewide Testing
School District Name
Source: National Center for Education Statistics (NCES), UT Dept. of Education
Profile last updated:
Frequently Asked Questions
What is Clarke N. Johnsen Jr High School's ranking?
Clarke N. Johnsen Jr High School is ranked #517 out of 975 schools, which ranks it among the bottom 50% of public schools in Utah.
What schools are Clarke N. Johnsen Jr High School often compared to?
Clarke N. Johnsen Jr High Schoolis often viewed alongside schools like Excelsior Academy, Tooele Jr High School by visitors of our site.
What percent of students have achieved state testing proficiency in math and reading?
40% of students have achieved math proficiency (compared to the 39% UT state average), while 41% of students have achieved reading proficiency (compared to the 43% UT state average).
How many students attend Clarke N. Johnsen Jr High School?
843 students attend Clarke N. Johnsen Jr High School.
What is the racial composition of the student body?
74% of Clarke N. Johnsen Jr High School students are White, 18% of students are Hispanic, 3% of students are Hawaiian, 3% of students are Two or more races, 1% of students are Asian, and 1% of students are Black.
What is the student:teacher ratio of Clarke N. Johnsen Jr High School?
Clarke N. Johnsen Jr High School has a student ration of 21:1, which is equal to the Utah state average of 21:1.
What grades does Clarke N. Johnsen Jr High School offer ?
Clarke N. Johnsen Jr High School offers enrollment in grades 7-8
What school district is Clarke N. Johnsen Jr High School part of?
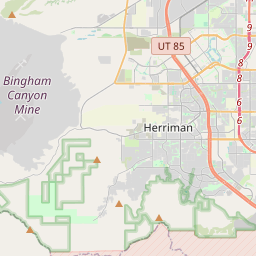
Clarke N. Johnsen Jr High School is part of Tooele School District.
School Reviews
2 3/21/2020
Great school! Some teachers are older and I don't agree with some of their curriculum! I would give them more stars if that was improved. My son has a substitute at least once a week in every subject, and they don't update grades regularly on Aspire. Other than those issues, it is a nice school.
3 4/7/2017
Amazing school! Some issues with some of the teach erst but overall great!
Review Clarke N. Johnsen Jr High School. Reviews should be a few sentences in length. Please include any comments on:
- Quality of academic programs, teachers, and facilities
- Availability of music, art, sports and other extracurricular activities
Recent Articles
![Understanding the U.S. Department of Education: Structure, Impact, and Evolution Understanding the U.S. Department of Education: Structure, Impact, and Evolution](https://images1.publicschoolreview.com/articlephoto/890/Understanding-the-U-S-Department-of-Education-Structure-Impact-and-Evolution-cidiytmhnw8ws0g0cosw40k4s-280.jpg)
Understanding the U.S. Department of Education: Structure, Impact, and Evolution
We explore how the Department of Education shapes American education, from its cabinet-level leadership to its impact on millions of students, written for general audiences seeking clarity on this vital institution.
![Segregation in K-12 Education: Colonial Era Segregation in K-12 Education: Colonial Era](https://images2.publicschoolreview.com/articlephoto/874/Segregation-in-K-12-Education-Origins-and-Differential-Treatment-during-the-Colonial-Era-7mcvjfs0jkg8w00wsogkcksks-280.jpg)
Segregation in K-12 Education: Colonial Era
Explore the origins of educational segregation during the colonial era and the differential treatment of Native American, African American, and white students. This article delves into the historical context, policies, and societal attitudes that shaped early education in colonial America, highlighting the disparities and injustices that persisted within the schooling systems of that time.
![Personalized Learning: Revolutionizing Education for the 21st Century Personalized Learning: Revolutionizing Education for the 21st Century](https://images1.publicschoolreview.com/articlephoto/889/Personalized-Learning-Revolutionizing-Education-for-the-21st-Century-coo0h88jjc8o0c0cgwgwwkosg-280.jpg)
December 16, 2024
Personalized Learning: Revolutionizing Education for the 21st CenturyExplore the revolutionary approach of Personalized Learning in K-12 education. This article discusses the benefits, challenges, and potential of tailoring education to individual student needs, incorporating technology and adaptive learning methods to prepare students for the 21st century.