School Overview
School Type
Grades Offered
Grades 1-12
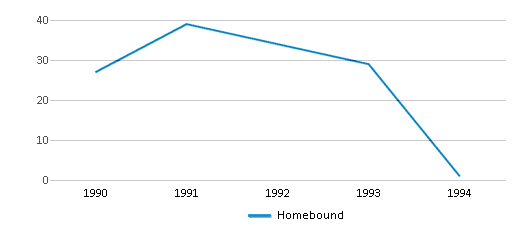
Total Students (93-94)
1 student
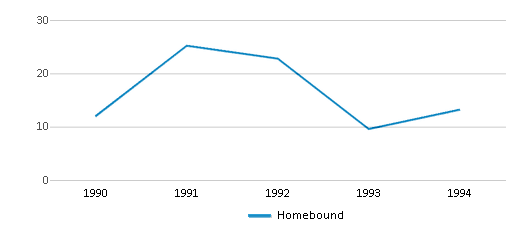
Total Classroom Teachers (93-94)
11 teachers
School Rankings
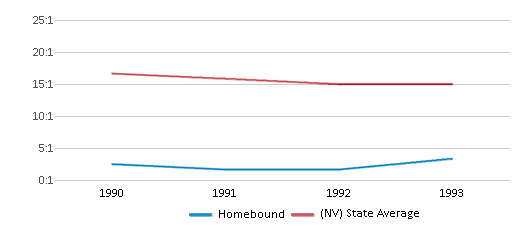
Student : Teacher Ratio
n/a
19:1
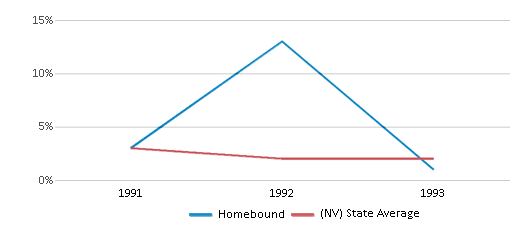
American Indian
(93-94)n/a
2%
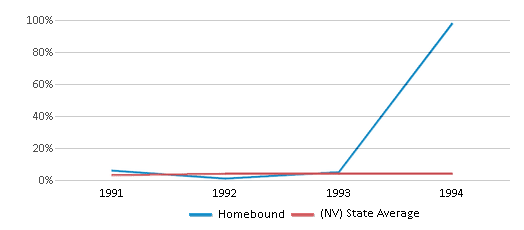
Asian
(93-94)98%
4%
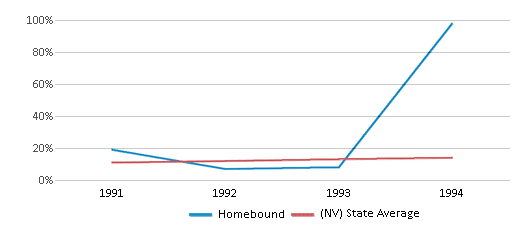
Hispanic
(93-94)98%
14%
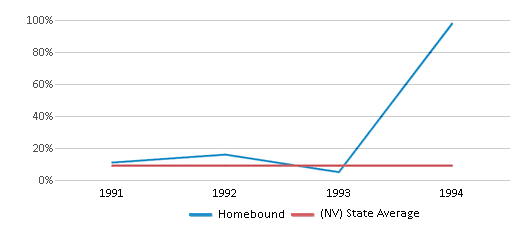
Black
(93-94)98%
9%
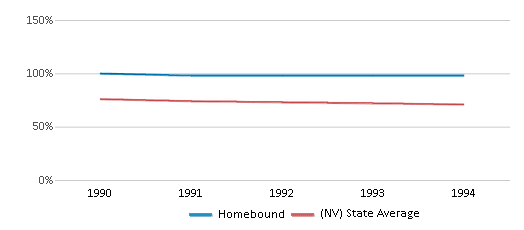
White
(93-94)98%
71%
Hawaiian
(93-94)n/a
n/a
Two or more races
(93-94)n/a
n/a
School Statewide Testing
School District Name
Source: National Center for Education Statistics (NCES), NV Dept. of Education
Frequently Asked Questions
How many students attend Homebound?
1 students attend Homebound.
What is the racial composition of the student body?
98% of Homebound students are Asian, 98% of students are Hispanic, 98% of students are Black, and 98% of students are White.
What grades does Homebound offer ?
Homebound offers enrollment in grades 1-12
What school district is Homebound part of?
Homebound is part of Washoe County School District.
Recent Articles

What Is A Charter School?
Explore the world of charter schools in this comprehensive guide. Learn about their history, how they operate, and the pros and cons of this educational innovation. Discover key facts about charter schools, including admission policies, demographics, and funding, as well as what to look for when considering a charter school for your child.

10 Reasons Why High School Sports Benefit Students
Discover the 10 compelling reasons why high school sports are beneficial for students. This comprehensive article explores how athletics enhance academic performance, foster personal growth, and develop crucial life skills. From improved fitness and time management to leadership development and community representation, learn why participating in high school sports can be a game-changer for students' overall success and well-being.

February 05, 2025
Understanding the U.S. Department of Education: Structure, Impact, and EvolutionWe explore how the Department of Education shapes American education, from its cabinet-level leadership to its impact on millions of students, written for general audiences seeking clarity on this vital institution.


