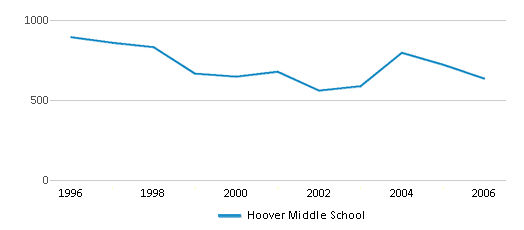
Hoover Middle School serves 634 students in grades 6-8.
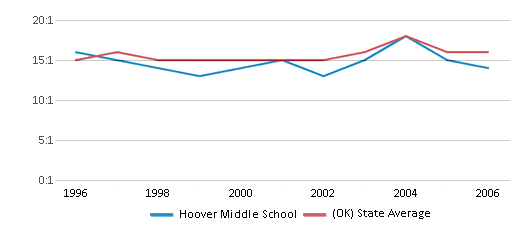
The student:teacher ratio of 14:1 was lower than the Oklahoma state level of 15:1.
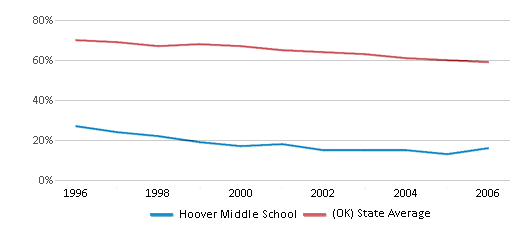
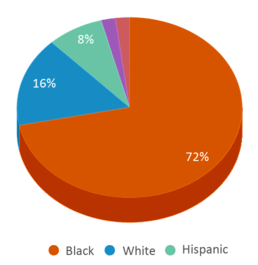
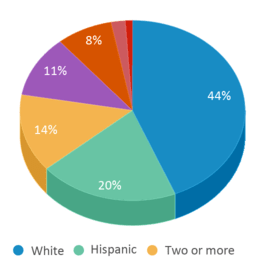
Minority enrollment was 84% of the student body (majority Black), which was higher than the Oklahoma state average of 56% (majority Hispanic and American Indian).
School Overview
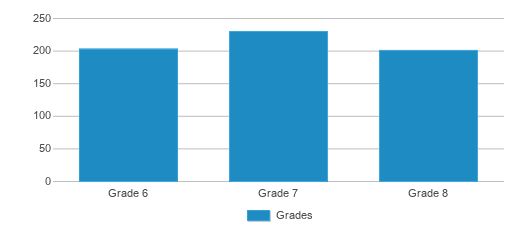
Grades Offered
Grades 6-8
Total Students
634 students
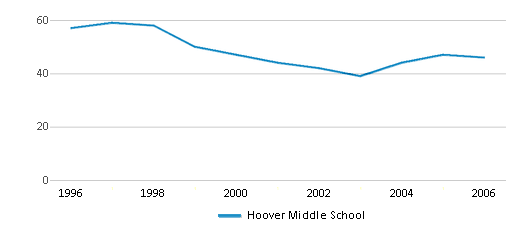
Total Classroom Teachers
46 teachers
Students by Grade
School Rankings
Student : Teacher Ratio
14:1
15:1
American Indian
2%
11%
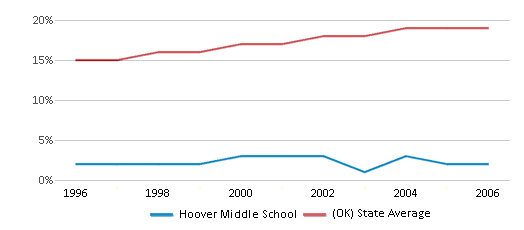
Asian
2%
2%
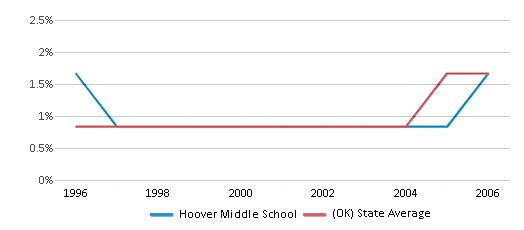
Hispanic
8%
20%
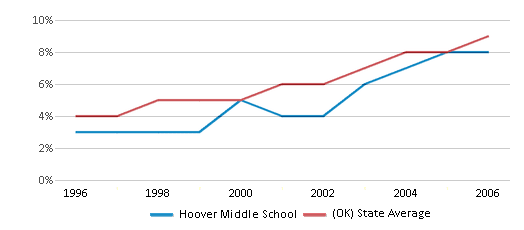
Black
72%
8%
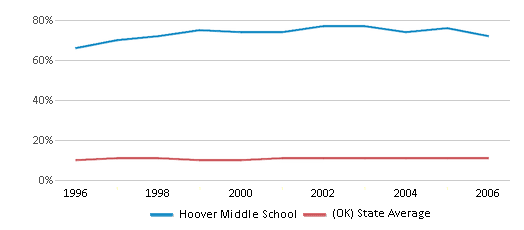
White
16%
44%
Hawaiian
n/a
1%
Two or more races
n/a
14%
All Ethnic Groups
Eligible for Free Lunch
90%
48%

Eligible for Reduced Lunch
5%
7%
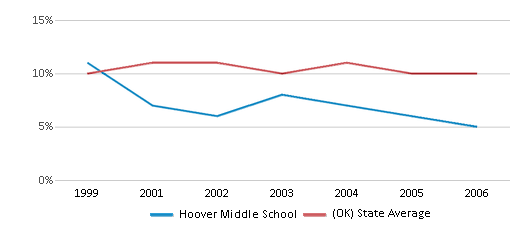
School Statewide Testing
School District Name
Source: National Center for Education Statistics (NCES), OK Dept. of Education
Frequently Asked Questions
How many students attend Hoover Middle School?
634 students attend Hoover Middle School.
What is the racial composition of the student body?
72% of Hoover Middle School students are Black, 16% of students are White, 8% of students are Hispanic, 2% of students are American Indian, and 2% of students are Asian.
What is the student:teacher ratio of Hoover Middle School?
Hoover Middle School has a student ration of 14:1, which is lower than the Oklahoma state average of 15:1.
What grades does Hoover Middle School offer ?
Hoover Middle School offers enrollment in grades 6-8
What school district is Hoover Middle School part of?
Hoover Middle School is part of Oklahoma City School District.
Recent Articles

What Is A Charter School?
Explore the world of charter schools in this comprehensive guide. Learn about their history, how they operate, and the pros and cons of this educational innovation. Discover key facts about charter schools, including admission policies, demographics, and funding, as well as what to look for when considering a charter school for your child.

10 Reasons Why High School Sports Benefit Students
Discover the 10 compelling reasons why high school sports are beneficial for students. This comprehensive article explores how athletics enhance academic performance, foster personal growth, and develop crucial life skills. From improved fitness and time management to leadership development and community representation, learn why participating in high school sports can be a game-changer for students' overall success and well-being.

February 05, 2025
Understanding the U.S. Department of Education: Structure, Impact, and EvolutionWe explore how the Department of Education shapes American education, from its cabinet-level leadership to its impact on millions of students, written for general audiences seeking clarity on this vital institution.


