For the 2025 school year, there is 1 public school serving 197 students in Miller TWP CCSD 210 School District. This district's average testing ranking is 7/10, which is in the top 50% of public schools in Illinois.
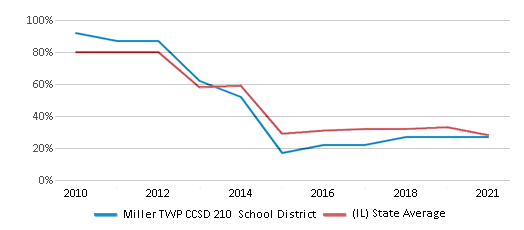
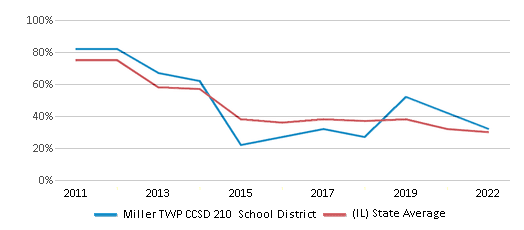
Public School in Miller TWP CCSD 210 School District have an average math proficiency score of 27% (versus the Illinois public school average of 26%), and reading proficiency score of 32% (versus the 30% statewide average).
Minority enrollment is 9% of the student body (majority Hispanic), which is less than the Illinois public school average of 56% (majority Hispanic).
Overview
This School District
This State (IL)
# Schools
1 School
4,399 Schools
# Students
197 Students
1,881,773 Students
# Teachers
14 Teachers
136,664 Teachers
Student : Teacher Ratio
14:1
14:1
District Rank
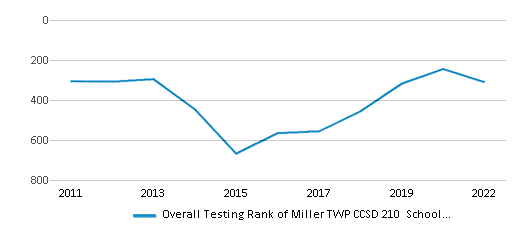
Miller TWP CCSD 210 School District, which is ranked within the top 50% of all 844 school districts in Illinois (based off of combined math and reading proficiency testing data) for the 2020-2021 school year.
Overall District Rank
#310 out of 852 school districts
(Top 50%)
(Top 50%)
Math Test Scores (% Proficient)
(20-21)25-29%
28%
Reading/Language Arts Test Scores (% Proficient)
30-34%
30%
Science Test Scores (% Proficient)
60-69%
50%
Students by Ethnicity:
Diversity Score
0.17
0.70
# American Indian Students
n/a
4,556 Students
% American Indian Students
n/a
1%
# Asian Students
n/a
103,630 Students
% Asian Students
n/a
6%
# Hispanic Students
14 Students
517,685 Students
% Hispanic Students
7%
28%
# Black Students
n/a
303,129 Students
% Black Students
n/a
16%
# White Students
179 Students
837,178 Students
% White Students
91%
45%
# Hawaiian Students
n/a
1,684 Students
% Hawaiian Students
n/a
n/a
# Two or more races Students
4 Students
78,057 Students
% of Two or more races Students
2%
4%
Students by Grade:
# Students in PK Grade:
5
79,660
# Students in K Grade:
22
120,716
# Students in 1st Grade:
16
126,380
# Students in 2nd Grade:
27
167,371
# Students in 3rd Grade:
24
130,316
# Students in 4th Grade:
21
130,337
# Students in 5th Grade:
22
129,914
# Students in 6th Grade:
20
132,189
# Students in 7th Grade:
18
135,696
# Students in 8th Grade:
22
137,626
# Students in 9th Grade:
-
149,483
# Students in 10th Grade:
-
150,499
# Students in 11th Grade:
-
146,819
# Students in 12th Grade:
-
144,755
# Ungraded Students:
-
12
District Revenue and Spending
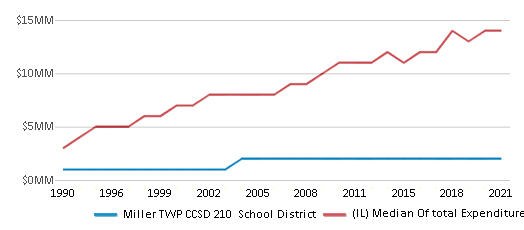
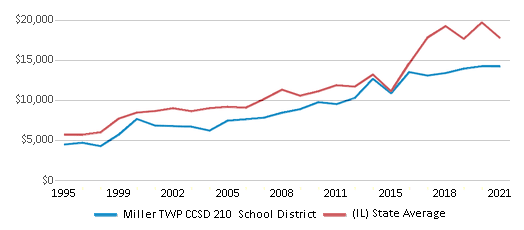
The revenue/student of $11,766 in this school district is less than the state median of $21,990. The school district revenue/student has declined by 17% over four school years.
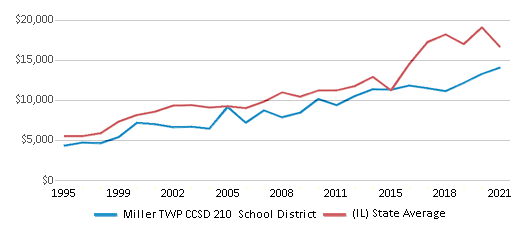
The school district's spending/student of $11,650 is less than the state median of $21,244. The school district spending/student has declined by 17% over four school years.
Total Revenue
$2 MM
$41,381 MM
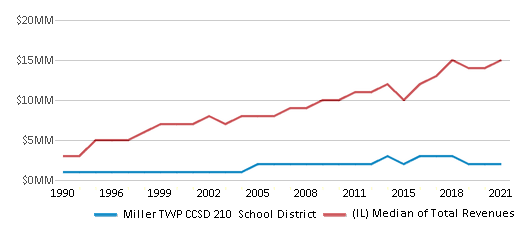
Spending
$2 MM
$39,976 MM
Revenue / Student
$11,766
$21,990
Spending / Student
$11,650
$21,244
Best Miller TWP CCSD 210 School District Public Schools (2025)
School
(Math and Reading Proficiency)
(Math and Reading Proficiency)
Location
Grades
Students
Rank: #11.
Milton Pope Elementary School
Rank:
7/
Top 50%10
3197 E 28th Rd
Marseilles, IL 61341
(815) 357-8151
Marseilles, IL 61341
(815) 357-8151
Grades: K-8
| 197 students
Frequently Asked Questions
How many schools belong to Miller TWP CCSD 210 School District?
Miller TWP CCSD 210 School District manages 1 public schools serving 197 students.
What is the rank of Miller TWP CCSD 210 School District?
Miller TWP CCSD 210 School District is ranked #312 out of 844 school districts in Illinois (top 50%) based off of combined math and reading proficiency testing data for the 2020-2021 school year.
What is the racial composition of students in Miller TWP CCSD 210 School District?
91% of Miller TWP CCSD 210 School District students are White, 7% of students are Hispanic, and 2% of students are Two or more races.
What is the student/teacher ratio of Miller TWP CCSD 210 School District?
Miller TWP CCSD 210 School District has a student/teacher ratio of 14:1, which is equal to the Illinois state average of 14:1.
What is Miller TWP CCSD 210 School District's spending/student ratio?
The school district's spending/student of $11,650 is less than the state median of $21,244. The school district spending/student has declined by 17% over four school years.
Recent Articles

What Is A Charter School?
Explore the world of charter schools in this comprehensive guide. Learn about their history, how they operate, and the pros and cons of this educational innovation. Discover key facts about charter schools, including admission policies, demographics, and funding, as well as what to look for when considering a charter school for your child.

10 Reasons Why High School Sports Benefit Students
Discover the 10 compelling reasons why high school sports are beneficial for students. This comprehensive article explores how athletics enhance academic performance, foster personal growth, and develop crucial life skills. From improved fitness and time management to leadership development and community representation, learn why participating in high school sports can be a game-changer for students' overall success and well-being.

February 05, 2025
Understanding the U.S. Department of Education: Structure, Impact, and EvolutionWe explore how the Department of Education shapes American education, from its cabinet-level leadership to its impact on millions of students, written for general audiences seeking clarity on this vital institution.


