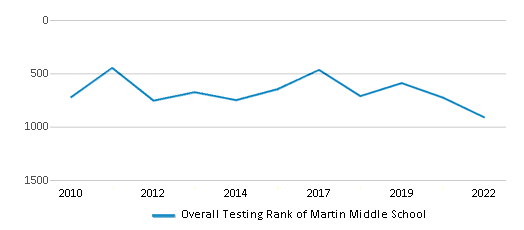
Serving 435 students in grades 6-8, Martin Middle School ranks in the bottom 50% of all schools in Tennessee for overall test scores (math proficiency is bottom 50%, and reading proficiency is bottom 50%).
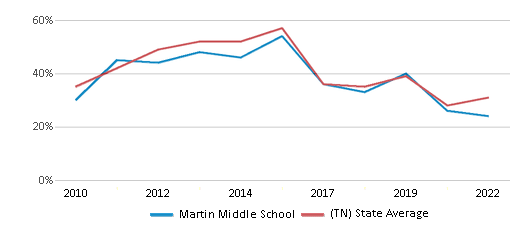
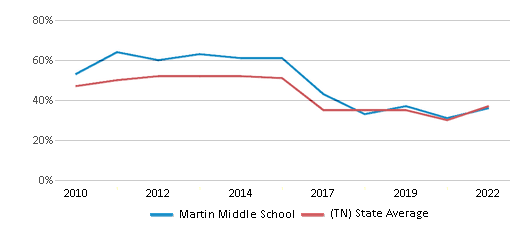
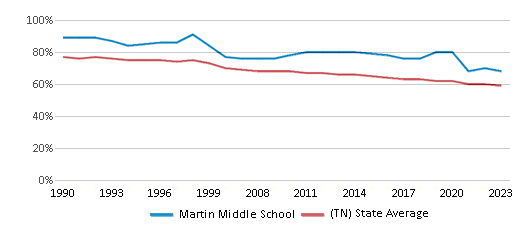
The percentage of students achieving proficiency in math is 24% (which is lower than the Tennessee state average of 31%). The percentage of students achieving proficiency in reading/language arts is 36% (which is lower than the Tennessee state average of 37%).
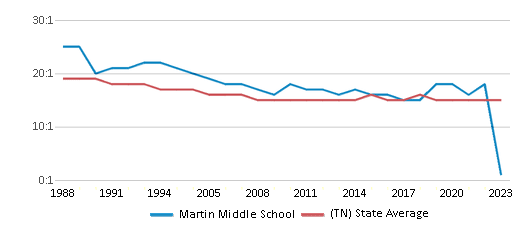
The student:teacher ratio of 19:1 is higher than the Tennessee state level of 15:1.
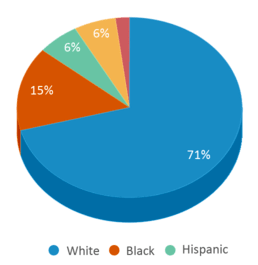
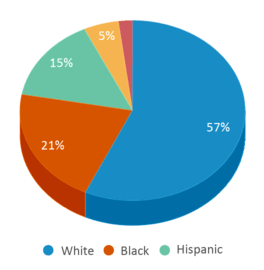
Minority enrollment is 29% of the student body (majority Black), which is lower than the Tennessee state average of 43% (majority Black).
Quick Stats (2025)
- Grades: 6-8
- Enrollment: 435 students
- Student:Teacher Ratio: 19:1
- Minority Enrollment: 29%
- Overall Testing Rank: Bottom 50% in TN
- Math Proficiency: 24% (Btm 50%)
- Reading Proficiency: 36% (Top 50%)
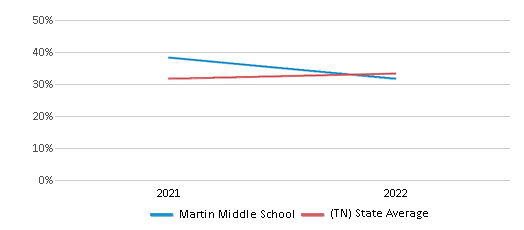
- Science Proficiency: 38% (Top 50%)
- Source: National Center for Education Statistics (NCES), TN Dept. of Education
School Overview
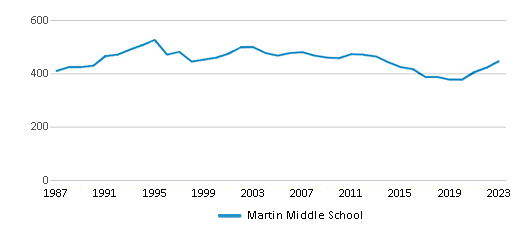
Martin Middle School's student population of 435 students has grown by 15% over five school years.
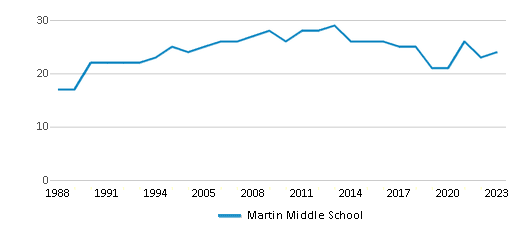
The teacher population of 23 teachers has grown by 9% over five school years.
Grades Offered
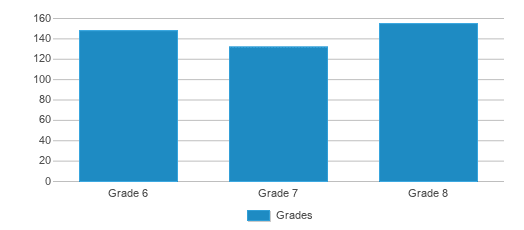
Grades 6-8
(Supplemental Virtual)
(Supplemental Virtual)
Total Students
435 students
Gender %
Total Classroom Teachers
23 teachers
Students by Grade
School Rankings
Martin Middle School ranks within the bottom 50% of all 1,761 schools in Tennessee (based off of combined math and reading proficiency testing data).
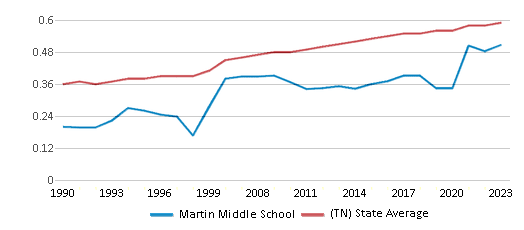
The diversity score of Martin Middle School is 0.47, which is less than the diversity score at state average of 0.61. The school's diversity has stayed relatively flat over five school years.
Overall Testing Rank
#912 out of 1761 schools
(Bottom 50%)
(Bottom 50%)
Math Test Scores (% Proficient)
24%
31%
Reading/Language Arts Test Scores (% Proficient)
36%
37%
Science Test Scores (% Proficient)
38%
40%
Student : Teacher Ratio
19:1
15:1
American Indian
n/a
n/a
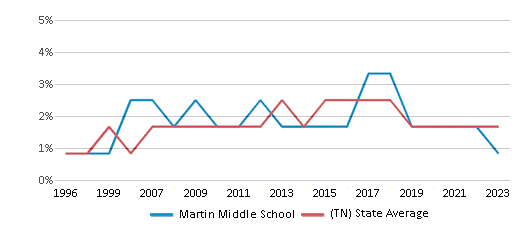
Asian
2%
2%
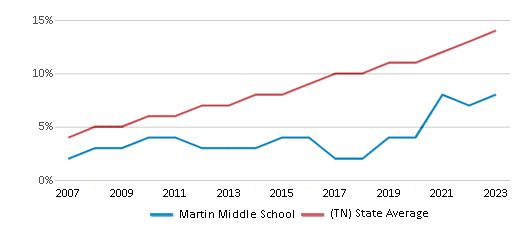
Hispanic
6%
15%
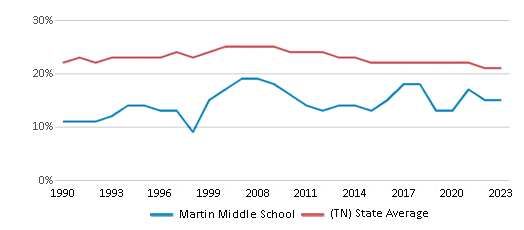
Black
15%
21%
White
71%
57%
Hawaiian
n/a
n/a
Two or more races
6%
5%
All Ethnic Groups
Participates in the National School Lunch Program (NSLP)
Yes
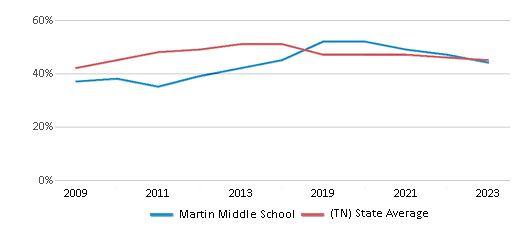
Eligible for Free Lunch
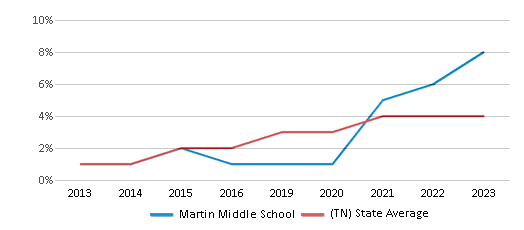
45%
45%
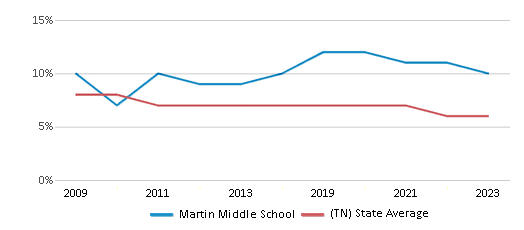
Eligible for Reduced Lunch
10%
6%
School Statewide Testing
School District Name
Source: National Center for Education Statistics (NCES), TN Dept. of Education
Profile last updated: 02/09/2025
Frequently Asked Questions
What is Martin Middle School's ranking?
Martin Middle School is ranked #912 out of 1,761 schools, which ranks it among the bottom 50% of public schools in Tennessee.
What schools are Martin Middle School often compared to?
Martin Middle Schoolis often viewed alongside schools like Martin Elementary School, Martin Primary by visitors of our site.
What percent of students have achieved state testing proficiency in math and reading?
24% of students have achieved math proficiency (compared to the 31% TN state average), while 36% of students have achieved reading proficiency (compared to the 37% TN state average).
How many students attend Martin Middle School?
435 students attend Martin Middle School.
What is the racial composition of the student body?
71% of Martin Middle School students are White, 15% of students are Black, 6% of students are Hispanic, 6% of students are Two or more races, and 2% of students are Asian.
What is the student:teacher ratio of Martin Middle School?
Martin Middle School has a student ration of 19:1, which is higher than the Tennessee state average of 15:1.
What grades does Martin Middle School offer ?
Martin Middle School offers enrollment in grades 6-8 (Supplemental Virtual).
What school district is Martin Middle School part of?
Martin Middle School is part of Weakley County School District.
School Reviews
Review Martin Middle School. Reviews should be a few sentences in length. Please include any comments on:
- Quality of academic programs, teachers, and facilities
- Availability of music, art, sports and other extracurricular activities
Recent Articles

Pros and Cons of Public School Exit Exams
From ensuring academic standards to assessing student readiness for college and career, readers will gain insights into the potential benefits of these exams. However, the article also delves into concerns such as increased stress on students, potential biases in testing, and the limitations of standardized assessments in capturing the full spectrum of student abilities. With a balanced perspective and expert analysis, this resource offers readers a comprehensive understanding of the complexities surrounding public school exit exams, empowering them to engage in informed discussions and decision-making regarding education policy and practice.
Prevent Brain Drain: Keep Your Kids’ Minds Sharp During Vacation
Long periods of time off from school can lead your child to lose valuable knowledge and skills. Learn more about brain drain and 4 ways to keep your child's mind revving, even during vacation. incorporating quality learning exercises into their spring, summer, and winter vacations.

Post-Pandemic Tips for Public School Parents and Students
The 2020-21 school year was unlike any other and hopefully not one we’ll repeat anytime soon. The COVID-19 pandemic changed the face of America’s public education system and we’re still seeing the effects. In this article, we’ll explore the impact of the pandemic on America’s public schools, see how they responded, and talk about some tips for returning to in-person education this fall.


