Serving 193 students in grades Kindergarten-8, Mountain Discovery ranks in the top 50% of all schools in North Carolina for overall test scores (math proficiency is bottom 50%, and reading proficiency is bottom 50%).
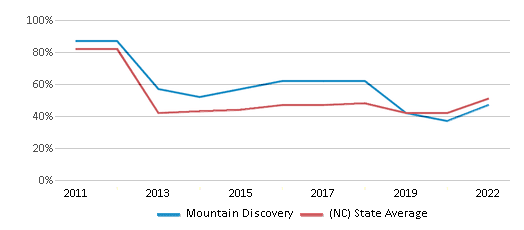
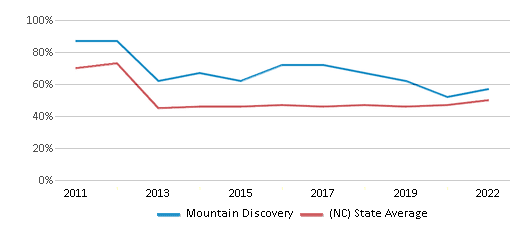
The percentage of students achieving proficiency in math is 45-49% (which is lower than the North Carolina state average of 51%). The percentage of students achieving proficiency in reading/language arts is 55-59% (which is higher than the North Carolina state average of 50%).
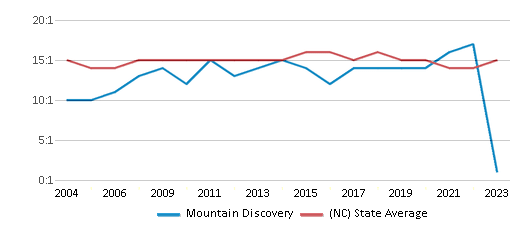
The student:teacher ratio of 18:1 is higher than the North Carolina state level of 15:1.
Minority enrollment is 22% of the student body (majority American Indian), which is lower than the North Carolina state average of 57% (majority Black).
Quick Stats (2025)
- School Type: Charter School
- Grades: Kindergarten-8
- Enrollment: 193 students
- Student:Teacher Ratio: 18:1
- Minority Enrollment: 22%
- Overall Testing Rank: Top 50% in NC
- Math Proficiency: 45-49% (Btm 50%)
- Reading Proficiency: 55-59% (Top 30%)
- Science Proficiency: 70-79% (Top 30%)
- Source: National Center for Education Statistics (NCES), NC Dept. of Education
Top Rankings
Mountain Discovery ranks among the top 20% of public schools in North Carolina for:
Category
Attribute
Community Size
School Overview
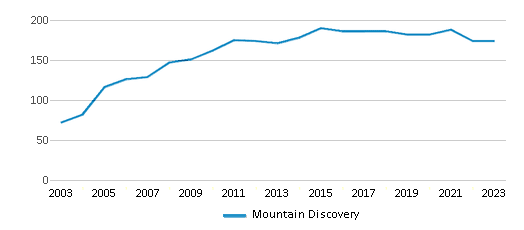
Mountain Discovery's student population of 193 students has grown by 6% over five school years.
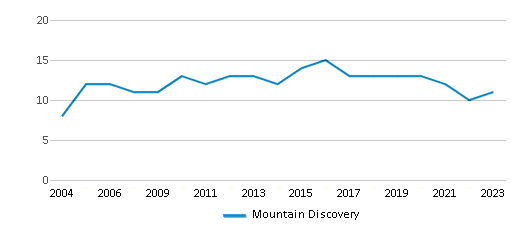
The teacher population of 11 teachers has declined by 15% over five school years.
School Type
Grades Offered
Grades Kindergarten-8
Total Students
193 students
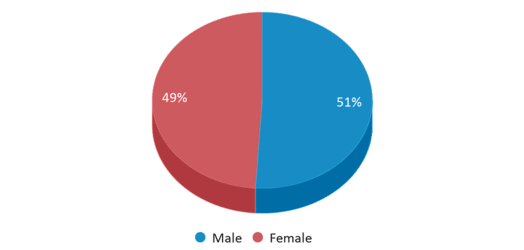
Gender %
Total Classroom Teachers
11 teachers
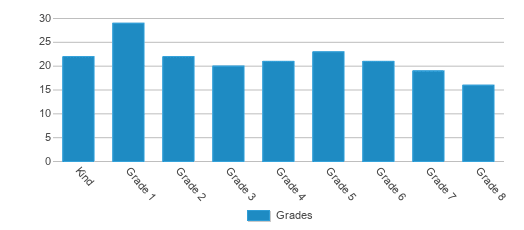
Students by Grade
School Rankings
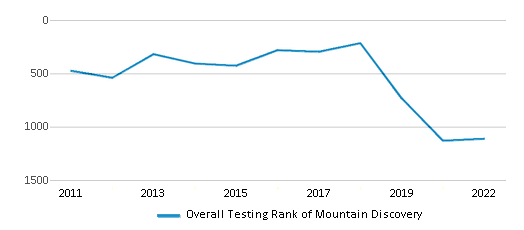
Mountain Discovery ranks within the top 50% of all 2,617 schools in North Carolina (based off of combined math and reading proficiency testing data).
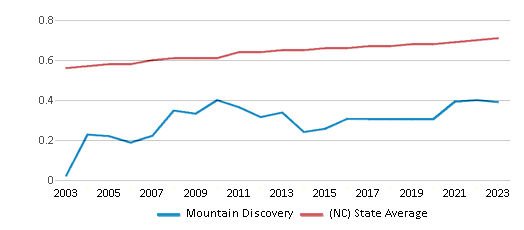
The diversity score of Mountain Discovery is 0.38, which is less than the diversity score at state average of 0.71. The school's diversity has stayed relatively flat over five school years.
Overall Testing Rank
#1112 out of 2617 schools
(Top 50%)
(Top 50%)
Math Test Scores (% Proficient)
45-49%
51%
Reading/Language Arts Test Scores (% Proficient)
55-59%
50%
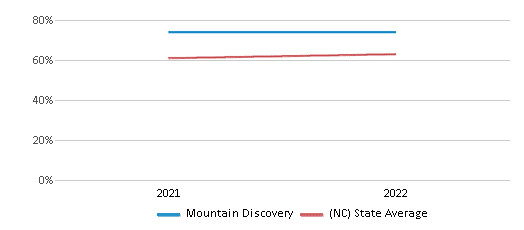
Science Test Scores (% Proficient)
70-79%
63%
Student : Teacher Ratio
18:1
15:1
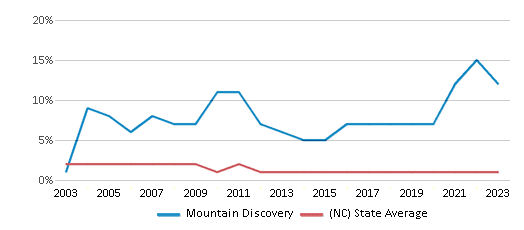
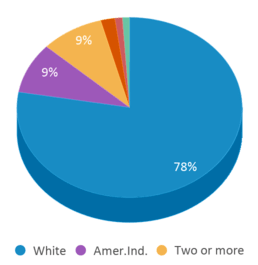
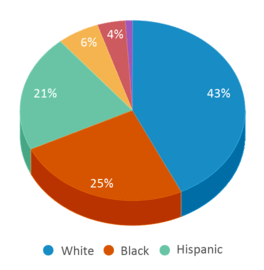
American Indian
9%
1%
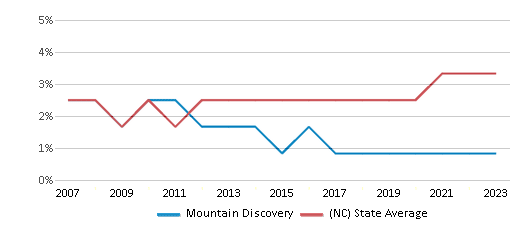
Asian
1%
4%
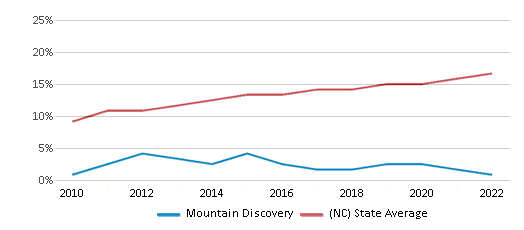
Hispanic
1%
21%
Black
2%
25%
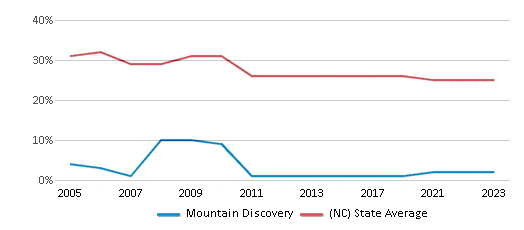
White
78%
43%
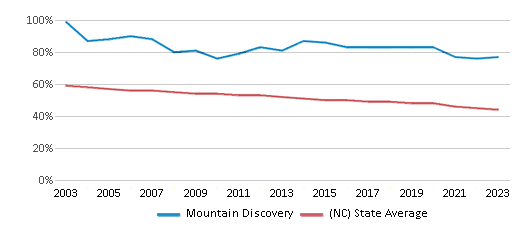
Hawaiian
n/a
n/a
Two or more races
9%
6%
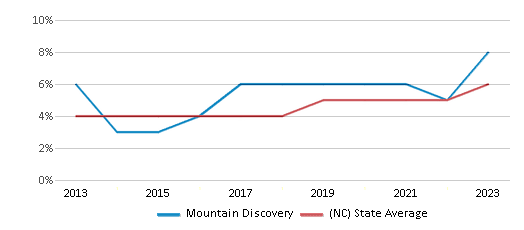
All Ethnic Groups
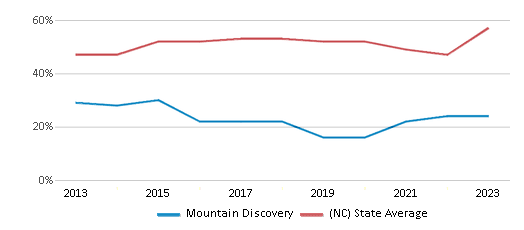
Eligible for Free Lunch
21%
68%
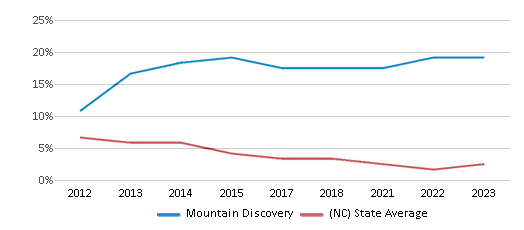
Eligible for Reduced Lunch
21%
1%
School Statewide Testing
School District Name
Source: National Center for Education Statistics (NCES), NC Dept. of Education
Profile last updated: 02/09/2025
Frequently Asked Questions
What is Mountain Discovery's ranking?
Mountain Discovery is ranked #1112 out of 2,617 schools, which ranks it among the top 50% of public schools in North Carolina.
What schools are Mountain Discovery often compared to?
Mountain Discoveryis often viewed alongside schools like Swain County East Elementary School, Swain County West Elementary School by visitors of our site.
What percent of students have achieved state testing proficiency in math and reading?
45-49% of students have achieved math proficiency (compared to the 51% NC state average), while 55-59% of students have achieved reading proficiency (compared to the 50% NC state average).
How many students attend Mountain Discovery?
193 students attend Mountain Discovery.
What is the racial composition of the student body?
78% of Mountain Discovery students are White, 9% of students are American Indian, 9% of students are Two or more races, 2% of students are Black, 1% of students are Asian, and 1% of students are Hispanic.
What is the student:teacher ratio of Mountain Discovery?
Mountain Discovery has a student ration of 18:1, which is higher than the North Carolina state average of 15:1.
What grades does Mountain Discovery offer ?
Mountain Discovery offers enrollment in grades Kindergarten-8
What school district is Mountain Discovery part of?
Mountain Discovery is part of Mountain Discovery Charter School District.
School Reviews
4 2/25/2017
What a sweet, small school. I feel so comfortable sending my child to MDSC. Teachers set up individualized programs for kids in math and reading. Kids are encouraged to be kids while being held accountable for their actions. My child is always going on great field trips, including a camping trip. I wish there was a school counselor to assist the behavior specialist and director. They have a good music and art program, although I wish they were full time and my child had more of both. They don't have a gym, but they do the best they can with what they have. The best thing is knowing that my child is safe and happy there.
5 11/25/2016
I love this school. The middle school set up is hands down the best around.
2 1/19/2012
Kindergarten is great! After that it goes down hill fast. The teachers are condescending, Especially the 4th grade. She has no problem cutting off your conversation when you are not saying what she wants to hear.
Parent involvement is not really accepted, unless it is to do maintenance and other labor chores. There are no sports programs other than to run laps up and down a mountain on pavement. They have no problem with punishment for wrong doing but very little to no praise for good accomplishments.
Our son has been going here for 4 1/2 years and we will be taking him out in the middle of the school year because it has gotten so bad. She shows favoritism to her daughter who is in her class this year. There is very little experiential learning, that we were looking forward to and is the reason we started our son's education here. The principal has no clue as to safe conditions during the winter. When other schools in the area are closed due to weather he will have the school remain open at risk of student safety. We are very disappointed with how the school is turning out. Each year we had hoped things would get better, but it seems to be going the other way and we will not subject our son to inferior education and teachers.
2 5/16/2011
Middle school is a disappointment. Students in 6th language arts are parked in front of a computer with no real instruction. Music teacher is part time and not even certified, band is a joke. No lunch or breakfast, no sports or gym. For PE my kid ran the driveway loop everyday. Small schools, but the principles touted on the website are deceiving. Science is hardly ever done, expeditionary principles not followed. Check out the local county schools (Swain, Jackson). They are a thousand times better.
2 5/3/2011
Academic programs are not superior to other schools. Teachers are not better qualified than other schools, nor is teaching philosophy alternate, so the program does not stand out. School does not offer any unique art or music, sports are essentially not available. Parent involvement is shut out. Facilities are abysmal, each class meets in a trailer with no separate facilities for lunch or sports. Heating and cooling units are very loud in each room. Most concern is the behavior system, the school is heavy on punishments with no consistent system for rewarding students.
2 1/25/2011
A complete failure! Poor instruction, supervision and treatment of students. Teachers seem scared of the administration. A weird group think like mentality as school culture. Parental involvement is no longer welcomed. An incompetent and angry school board. Your kids would be better off anywhere else
2 12/13/2010
Very unhappy with the instruction in Middle School. No real science curriculum. Teacher does not follow Expeditionary Learning Principles. School Director is not qualified for the position. The school board is ineffective. No Gym, no lunches, no sports. Mobile homes for classrooms. Swain County schools shine in comparison.
Review Mountain Discovery. Reviews should be a few sentences in length. Please include any comments on:
- Quality of academic programs, teachers, and facilities
- Availability of music, art, sports and other extracurricular activities
Recent Articles

What Is A Charter School?
Explore the world of charter schools in this comprehensive guide. Learn about their history, how they operate, and the pros and cons of this educational innovation. Discover key facts about charter schools, including admission policies, demographics, and funding, as well as what to look for when considering a charter school for your child.

10 Reasons Why High School Sports Benefit Students
Discover the 10 compelling reasons why high school sports are beneficial for students. This comprehensive article explores how athletics enhance academic performance, foster personal growth, and develop crucial life skills. From improved fitness and time management to leadership development and community representation, learn why participating in high school sports can be a game-changer for students' overall success and well-being.

February 05, 2025
Understanding the U.S. Department of Education: Structure, Impact, and EvolutionWe explore how the Department of Education shapes American education, from its cabinet-level leadership to its impact on millions of students, written for general audiences seeking clarity on this vital institution.


