P E P Elementary School ranks in the bottom 50% of all schools in Texas for overall test scores (math proficiency is bottom 50%, and reading proficiency is bottom 50%).
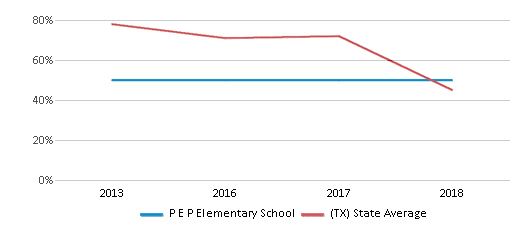
The percentage of students achieving proficiency in math was <50% (which was lower than the Texas state average of 78%). The percentage of students achieving proficiency in reading/language arts was <50% (which was higher than the Texas state average of 45%).
School Overview
School Type
Grades Offered
Grades 9-12
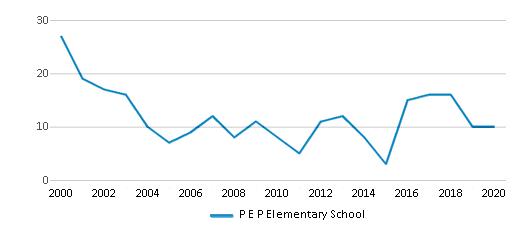
Total Students (19-20)
10 students
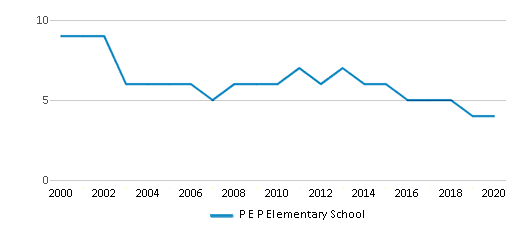
Total Classroom Teachers (19-20)
4 teachers
School Rankings
Math Test Scores (% Proficient)
(12-13)<50%
78%
Reading/Language Arts Test Scores (% Proficient)
(17-18)<50%
45%
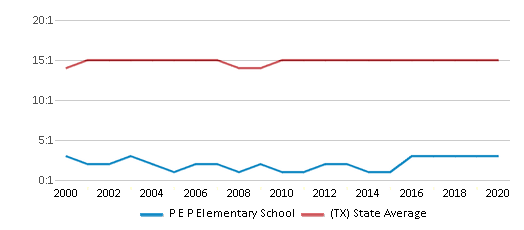
Student : Teacher Ratio
n/a
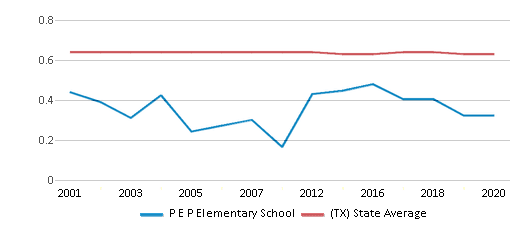
14:1
American Indian
(19-20)n/a
n/a
Asian
(19-20)n/a
5%
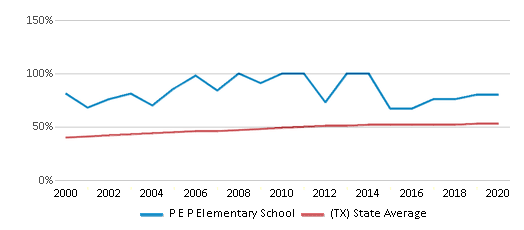
Hispanic
(19-20)80%
53%
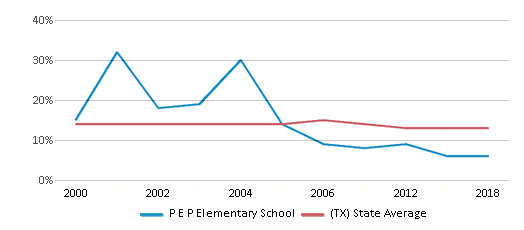
Black
(19-20)n/a
13%
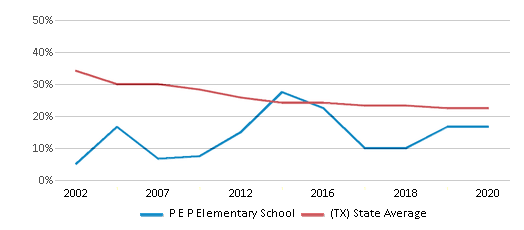
White
(19-20)20%
27%
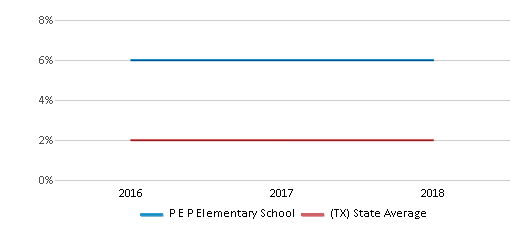
Hawaiian
(19-20)n/a
n/a
Two or more races
(19-20)n/a
2%
Graduation Rate
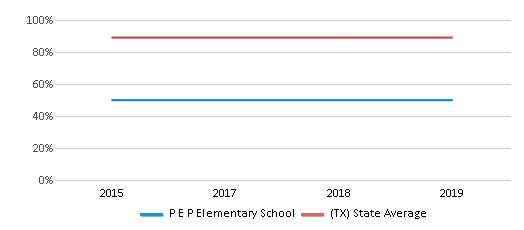
(18-19)≥50%
89%
Eligible for Free Lunch (19-20)
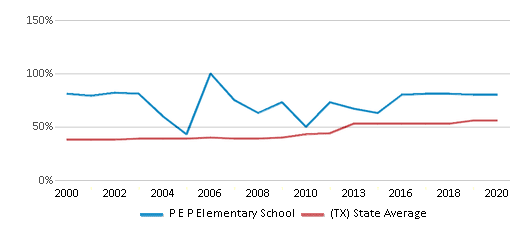
80%
56%
Eligible for Reduced Lunch (19-20)
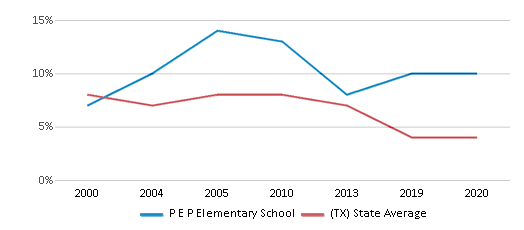
10%
4%
School Statewide Testing
School District Name
Source: National Center for Education Statistics (NCES), TX Dept. of Education
Frequently Asked Questions
What percent of students have achieved state testing proficiency in math and reading?
<50% of students have achieved math proficiency (compared to the 78% TX state average), while <50% of students have achieved reading proficiency (compared to the 45% TX state average).
What is the graduation rate of P E P Elementary School?
The graduation rate of P E P Elementary School is 50%, which is lower than the Texas state average of 89%.
How many students attend P E P Elementary School?
10 students attend P E P Elementary School.
What is the racial composition of the student body?
80% of P E P Elementary School students are Hispanic, and 20% of students are White.
What grades does P E P Elementary School offer ?
P E P Elementary School offers enrollment in grades 9-12
What school district is P E P Elementary School part of?
P E P Elementary School is part of Morton Independent School District.
Recent Articles

Sexual Harassment at Age 6: The Tale of a First Grade Suspension
A six-year old in Aurora, Colorado, was suspended after singing an LMFAO song to a little girl in his class and reportedly “shaking his booty.” We look at the case and the sexual harassment problem in public schools today.

How Scaffolding Could Change the Way Your Child Learns
This article explores the concept of instructional scaffolding, a teaching method that enhances learning by breaking down complex tasks into manageable parts. It highlights how scaffolding supports students in developing critical thinking skills and becoming more independent learners. The article discusses the benefits of scaffolding, including improved engagement and reduced anxiety, and provides strategies for its implementation across various educational levels.

February 05, 2025
Understanding the U.S. Department of Education: Structure, Impact, and EvolutionWe explore how the Department of Education shapes American education, from its cabinet-level leadership to its impact on millions of students, written for general audiences seeking clarity on this vital institution.


