For the 2025 school year, there is 1 public middle school serving 930 students in Wissahickon Charter School District. This district's average middle testing ranking is 2/10, which is in the bottom 50% of public middle schools in Pennsylvania.
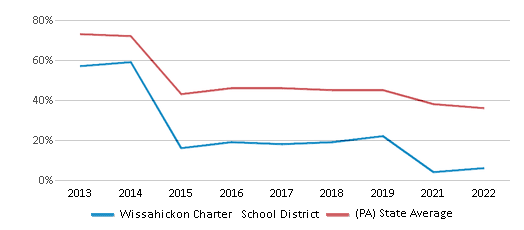
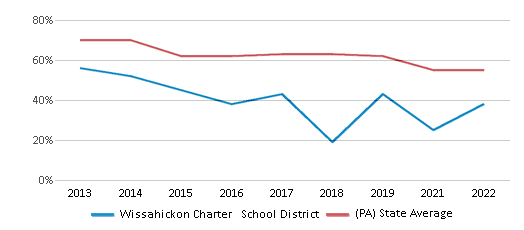
Public Middle School in Wissahickon Charter School District have an average math proficiency score of 6% (versus the Pennsylvania public middle school average of 26%), and reading proficiency score of 38% (versus the 52% statewide average).
Minority enrollment is 99% of the student body (majority Black), which is more than the Pennsylvania public middle school average of 46% (majority Black and Hispanic).
Overview
This School District
This State (PA)
# Schools
1 School
923 Schools
# Students
930 Students
591,579 Students
# Teachers
59 Teachers
44,337 Teachers
Student : Teacher Ratio
16:1
16:1
District Rank
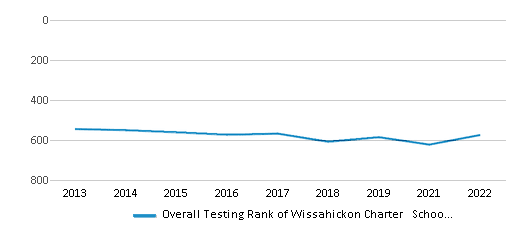
Wissahickon Charter School District, which is ranked within the bottom 50% of all 675 school districts in Pennsylvania (based off of combined math and reading proficiency testing data) for the 2021-2022 school year.
Overall District Rank
#574 out of 684 school districts
(Bottom 50%)
(Bottom 50%)
Math Test Scores (% Proficient)
6%
36%
Reading/Language Arts Test Scores (% Proficient)
38%
55%
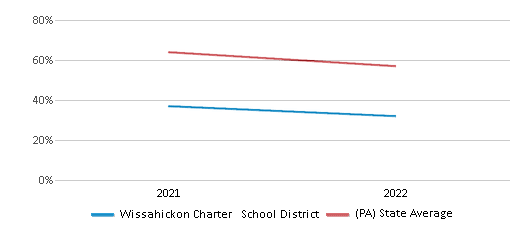
Science Test Scores (% Proficient)
30-34%
57%
Students by Ethnicity:
Diversity Score
0.16
0.65
# American Indian Students
n/a
1,239 Students
% American Indian Students
n/a
n/a
# Asian Students
n/a
25,214 Students
% Asian Students
n/a
4%
# Hispanic Students
37 Students
97,970 Students
% Hispanic Students
4%
17%
# Black Students
853 Students
118,593 Students
% Black Students
92%
20%
# White Students
9 Students
316,870 Students
% White Students
1%
54%
# Hawaiian Students
1 Student
586 Students
% Hawaiian Students
n/a
n/a
# Two or more races Students
30 Students
30,545 Students
% of Two or more races Students
3%
5%
Students by Grade:
# Students in PK Grade:
-
1,623
# Students in K Grade:
100
15,933
# Students in 1st Grade:
105
17,465
# Students in 2nd Grade:
105
18,204
# Students in 3rd Grade:
106
18,156
# Students in 4th Grade:
107
19,235
# Students in 5th Grade:
104
33,809
# Students in 6th Grade:
103
92,720
# Students in 7th Grade:
101
128,929
# Students in 8th Grade:
99
129,773
# Students in 9th Grade:
-
34,725
# Students in 10th Grade:
-
28,504
# Students in 11th Grade:
-
26,584
# Students in 12th Grade:
-
25,919
# Ungraded Students:
-
-
District Revenue and Spending
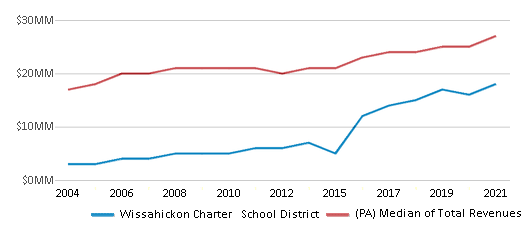
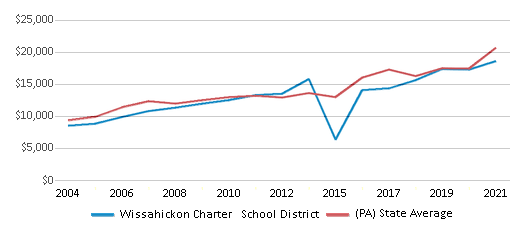
The revenue/student of $19,269 in this school district is less than the state median of $23,696. The school district revenue/student has stayed relatively flat over four school years.
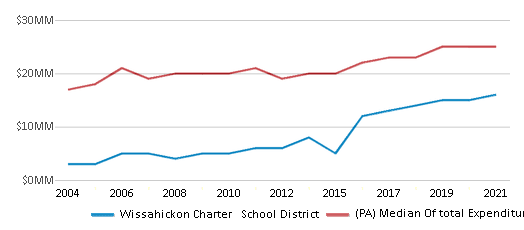
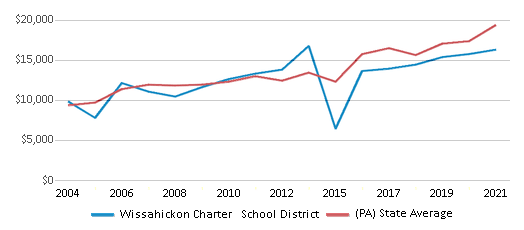
The school district's spending/student of $16,904 is less than the state median of $23,119. The school district spending/student has stayed relatively flat over four school years.
Total Revenue
$18 MM
$39,541 MM
Spending
$16 MM
$38,578 MM
Revenue / Student
$19,269
$23,696
Spending / Student
$16,904
$23,119
Best Wissahickon Charter School District Public Middle Schools (2025)
School
(Math and Reading Proficiency)
(Math and Reading Proficiency)
Location
Grades
Students
Rank: #11.
Wissahickon Charter School
Charter School
(Math: 6% | Reading: 38%)
Rank:
Rank:
2/
Bottom 50%10
4700 G Wissahickon Ave
Philadelphia, PA 19144
(267) 338-1020
Philadelphia, PA 19144
(267) 338-1020
Grades: K-8
| 930 students
Recent Articles

Charter Schools Produce More Graduates than Public Schools
Studies show that graduation rates at charter schools outpace graduation rates at public schools. Learn how charter schools have been able to improve graduation rates, and the positive effects charter schools have on students’ lives in the long-term.

Can Your Child’s School Test Students for Drugs?
Learn about the controversy surrounding public schools testing students for drug and substance use.

Bussing: North Carolina's New Student Assignment Plan
We analyze a new plan for student assignment in two North Carolina school districts and the public reaction to the idea of bussing students – as well as alternatives that have been proposed by education experts.


