Serving 565 students in grades Kindergarten-4, Pleasant View Elementary School ranks in the top 20% of all schools in Tennessee for overall test scores (math proficiency is top 30%, and reading proficiency is top 30%).
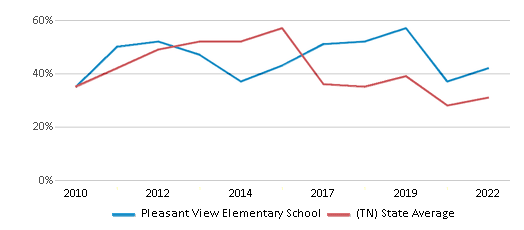
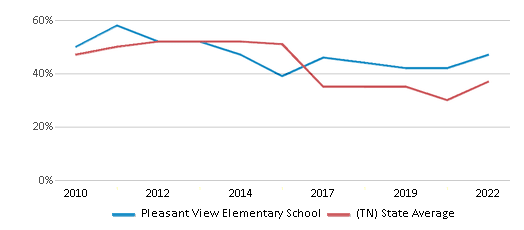
The percentage of students achieving proficiency in math is 40-44% (which is higher than the Tennessee state average of 31%). The percentage of students achieving proficiency in reading/language arts is 45-49% (which is higher than the Tennessee state average of 37%).
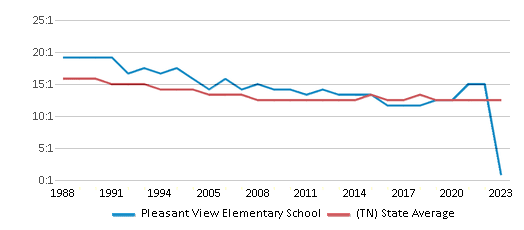
The student:teacher ratio of 17:1 is higher than the Tennessee state level of 15:1.
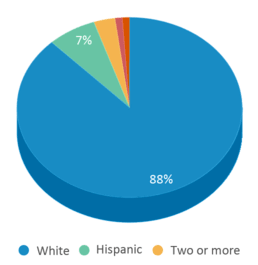
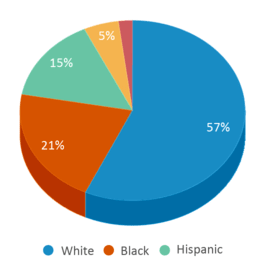
Minority enrollment is 12% of the student body (majority Hispanic), which is lower than the Tennessee state average of 43% (majority Black).
Quick Stats (2025)
- Grades: Kindergarten-4
- Enrollment: 565 students
- Student:Teacher Ratio: 17:1
- Minority Enrollment: 12%
- Overall Testing Rank: Top 20% in TN
- Math Proficiency: 40-44% (Top 30%)
- Reading Proficiency: 45-49% (Top 20%)
- Science Proficiency: 30-34% (Btm 50%)
- Source: National Center for Education Statistics (NCES), TN Dept. of Education
Top Rankings
Pleasant View Elementary School ranks among the top 20% of public schools in Tennessee for:
Category
Attribute
Overall Rank
Reading/Language Arts Proficiency
School Overview
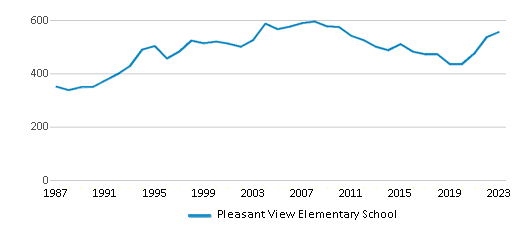
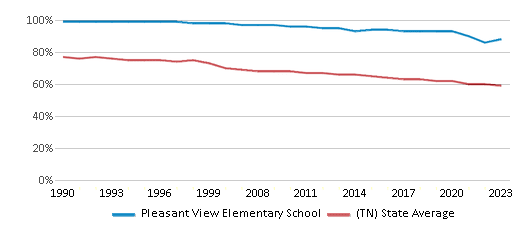
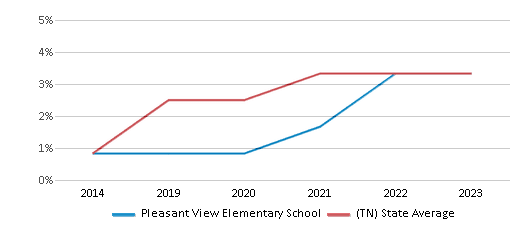
Pleasant View Elementary School's student population of 565 students has grown by 29% over five school years.
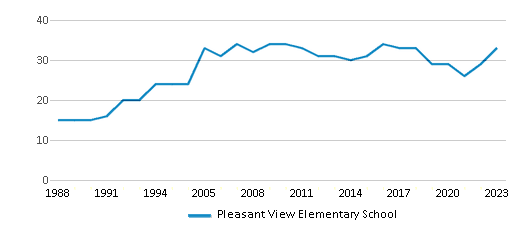
The teacher population of 33 teachers has grown by 13% over five school years.
Grades Offered
Grades Kindergarten-4
Total Students
565 students
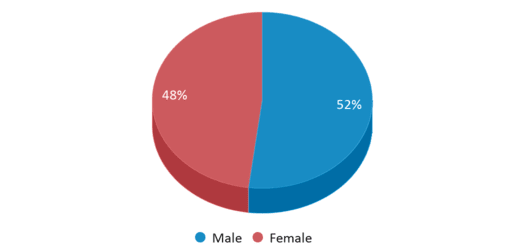
Gender %
Total Classroom Teachers
33 teachers
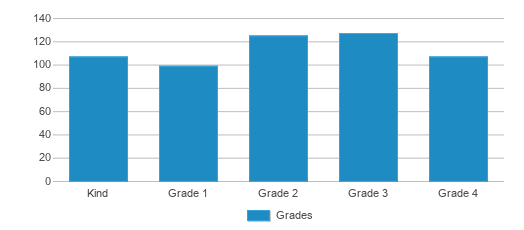
Students by Grade
School Rankings
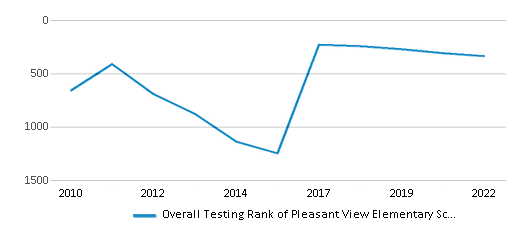
Pleasant View Elementary School ranks within the top 20% of all 1,761 schools in Tennessee (based off of combined math and reading proficiency testing data).
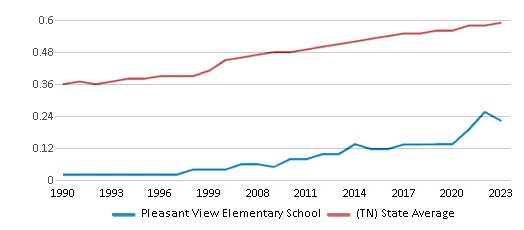
The diversity score of Pleasant View Elementary School is 0.22, which is less than the diversity score at state average of 0.61. The school's diversity has stayed relatively flat over five school years.
Overall Testing Rank
#338 out of 1761 schools
(Top 20%)
(Top 20%)
Math Test Scores (% Proficient)
40-44%
31%
Reading/Language Arts Test Scores (% Proficient)
45-49%
37%
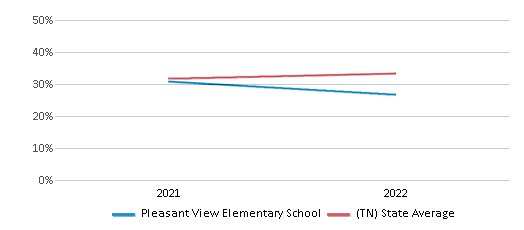
Science Test Scores (% Proficient)
30-34%
40%
Student : Teacher Ratio
17:1
15:1
American Indian
n/a
n/a
Asian
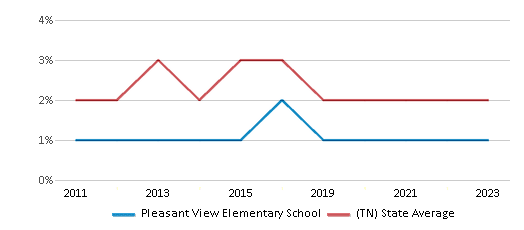
1%
2%
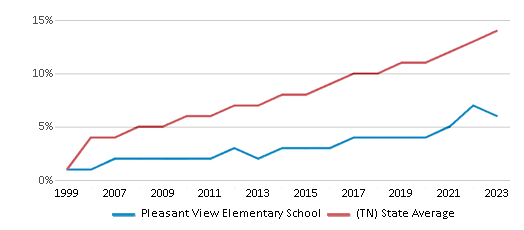
Hispanic
7%
15%
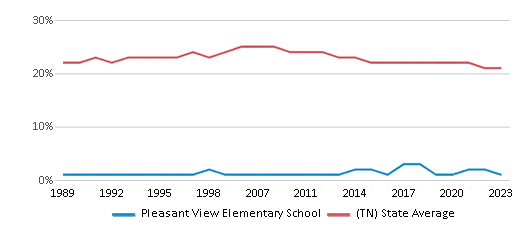
Black
1%
21%
White
88%
57%
Hawaiian
n/a
n/a
Two or more races
3%
5%
All Ethnic Groups
Participates in the National School Lunch Program (NSLP)
Yes
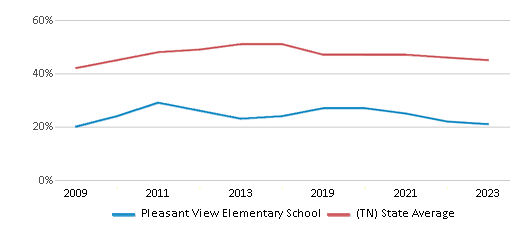
Eligible for Free Lunch
21%
45%
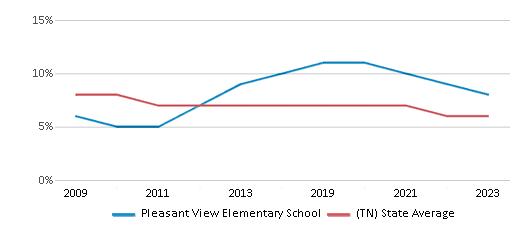
Eligible for Reduced Lunch
8%
6%
School Statewide Testing
School District Name
Source: National Center for Education Statistics (NCES), TN Dept. of Education
Profile last updated: 02/09/2025
Frequently Asked Questions
What is Pleasant View Elementary School's ranking?
Pleasant View Elementary School is ranked #338 out of 1,761 schools, which ranks it among the top 20% of public schools in Tennessee.
What schools are Pleasant View Elementary School often compared to?
Pleasant View Elementary Schoolis often viewed alongside schools like Ashland City Elementary School, Sycamore High School, Sycamore Middle School by visitors of our site.
What percent of students have achieved state testing proficiency in math and reading?
40-44% of students have achieved math proficiency (compared to the 31% TN state average), while 45-49% of students have achieved reading proficiency (compared to the 37% TN state average).
How many students attend Pleasant View Elementary School?
565 students attend Pleasant View Elementary School.
What is the racial composition of the student body?
88% of Pleasant View Elementary School students are White, 7% of students are Hispanic, 3% of students are Two or more races, 1% of students are Asian, and 1% of students are Black.
What is the student:teacher ratio of Pleasant View Elementary School?
Pleasant View Elementary School has a student ration of 17:1, which is higher than the Tennessee state average of 15:1.
What grades does Pleasant View Elementary School offer ?
Pleasant View Elementary School offers enrollment in grades Kindergarten-4
What school district is Pleasant View Elementary School part of?
Pleasant View Elementary School is part of Cheatham County School District.
School Reviews
5 8/17/2016
My children have been attending Pleasant View Elementary since 2004. We have been extremely impressed with the level of teachers and support we get as parents. The principal, Mr. Keith Miller, as always been responsive when I had concerns. The teacher to student ratio in low and always more 1-on-1 time.
5 8/9/2010
Pleasant View Elementary school came highly recommended by several people in our church. We have never been disappointed. I am confident my children are receving a quality education and are being challeged to reach their potential. Parents are strongly encouraged to be involved in the classroom and are always welcome in the school building. I can't understand how any parent could be dissatisfied with the quality of education at this school.
2 8/2/2010
When compared to other Cheatham County schools, this school had a good reputation by a few families at our church when we first move to the area. I was shocked at the lack of acceptance of children of other various minority heritages. My family was discouraged of participating in any extracurricular activities or social functions within the classroom. We were also disappointed by the lack of education my child received. She reached her targeted reading level before the holidays and was never challenged beyond it. They simply starting the reading curriculum over again when the Spring semester began! She learned to speak redneck English and became fearful of her teacher due to the constant yelling. The only form of discipline that was ever used by the staff and after school staff was yelling; assuming that the after school staff paid attention to children enough to notice them. Usually they were too busy talking to each other to notice a parent in the room or if a child had been picked up. It required the next academic year in a private school for my child to catch back up with her peers academically and socially. It was a traumatic experience for both my child and myself that I cannot forgive myself for years later. I've lost what little faith I had in Middle Tennessee's public school system after this experience and will continue to send all of my children to a quality private school.
Review Pleasant View Elementary School. Reviews should be a few sentences in length. Please include any comments on:
- Quality of academic programs, teachers, and facilities
- Availability of music, art, sports and other extracurricular activities
Recent Articles

What Is A Charter School?
Explore the world of charter schools in this comprehensive guide. Learn about their history, how they operate, and the pros and cons of this educational innovation. Discover key facts about charter schools, including admission policies, demographics, and funding, as well as what to look for when considering a charter school for your child.

10 Reasons Why High School Sports Benefit Students
Discover the 10 compelling reasons why high school sports are beneficial for students. This comprehensive article explores how athletics enhance academic performance, foster personal growth, and develop crucial life skills. From improved fitness and time management to leadership development and community representation, learn why participating in high school sports can be a game-changer for students' overall success and well-being.

February 05, 2025
Understanding the U.S. Department of Education: Structure, Impact, and EvolutionWe explore how the Department of Education shapes American education, from its cabinet-level leadership to its impact on millions of students, written for general audiences seeking clarity on this vital institution.


