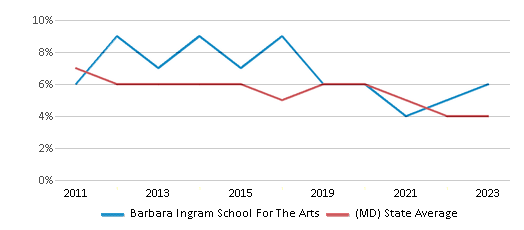
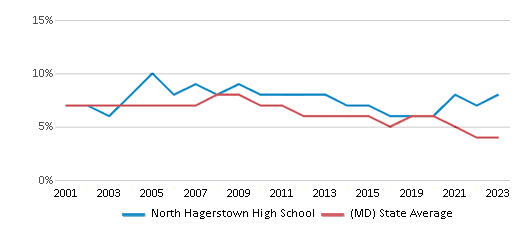
Barbara Ingram School For The Arts vs. North Hagerstown High School
Should you attend Barbara Ingram School For The Arts or North Hagerstown High School? Visitors to our site frequently compare these two schools. Compare their rankings, test scores, reviews and more to help you determine which school is the best choice for you.
School Overview
School
Top Rankings
Barbara Ingram School For The Arts ranks among the top 20% of public schools in Maryland for:
Category
Attribute
Overall Rank
Reading/Language Arts Proficiency
Graduation Rate
Community Size
North Hagerstown High School ranks among the top 20% of public schools in Maryland for:
Category
Attribute
Diversity
Overview
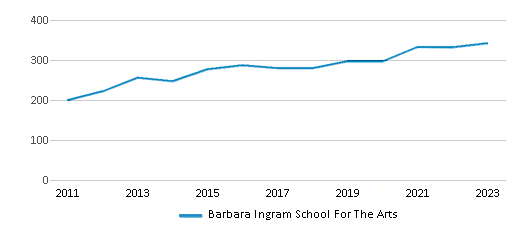
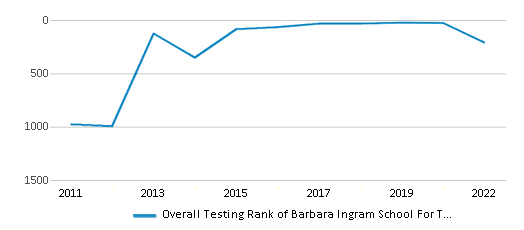
Serving 330 students in grades 9-12, Barbara Ingram School For The Arts ranks in the top 20% of all schools in Maryland for overall test scores (math proficiency is top 50%, and reading proficiency is top 50%).
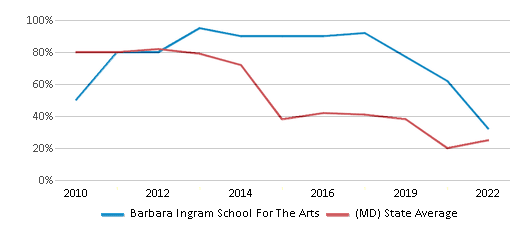
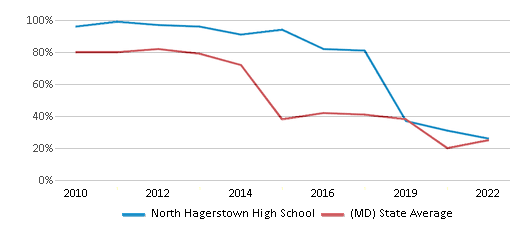
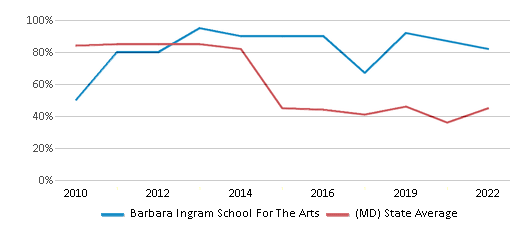
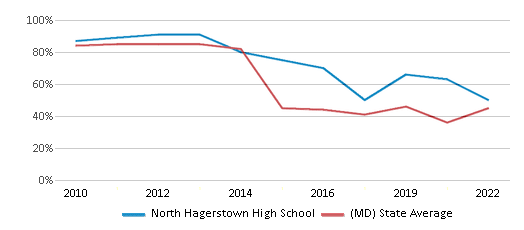
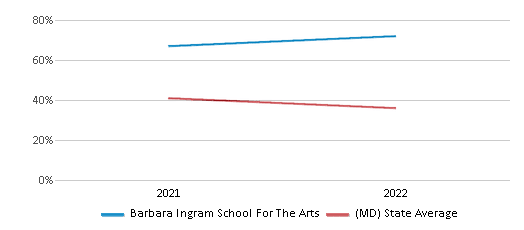
The percentage of students achieving proficiency in math is 30-34% (which is higher than the Maryland state average of 25%). The percentage of students achieving proficiency in reading/language arts is 80-84% (which is higher than the Maryland state average of 45%).
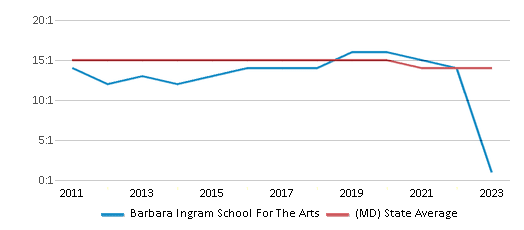
The student:teacher ratio of 14:1 is equal to the Maryland state level of 14:1.
Minority enrollment is 32% of the student body (majority Hispanic and Black), which is lower than the Maryland state average of 68% (majority Black).
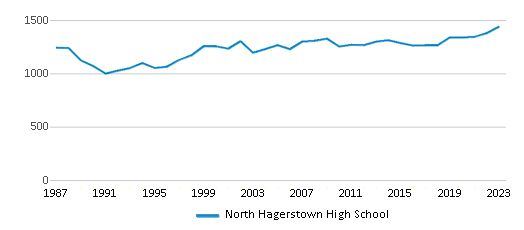
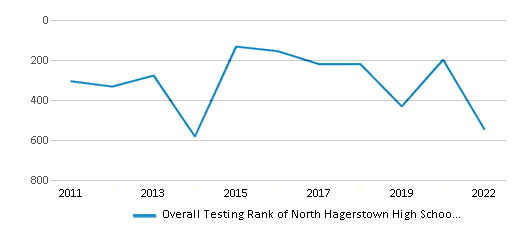
Serving 1,558 students in grades 9-12, North Hagerstown High School ranks in the top 50% of all schools in Maryland for overall test scores (math proficiency is top 50%, and reading proficiency is top 50%).
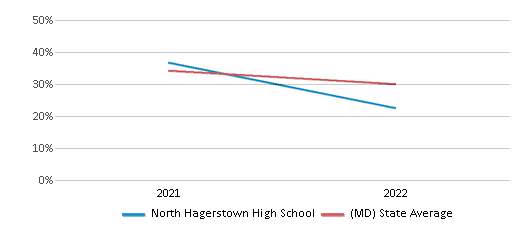
The percentage of students achieving proficiency in math is 26% (which is higher than the Maryland state average of 25%). The percentage of students achieving proficiency in reading/language arts is 50% (which is higher than the Maryland state average of 45%).
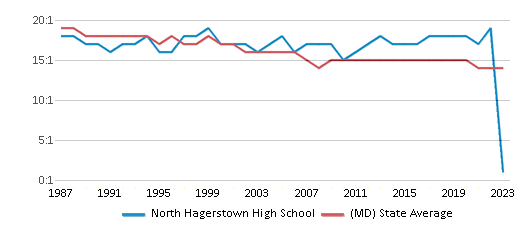
The student:teacher ratio of 19:1 is higher than the Maryland state level of 14:1.
Minority enrollment is 54% of the student body (majority Black), which is lower than the Maryland state average of 68% (majority Black).
Grades Offered
9-12
9-12
Total Students
330 students
1,558 students
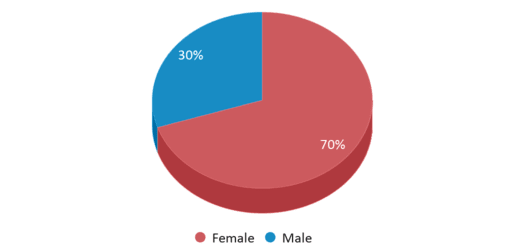
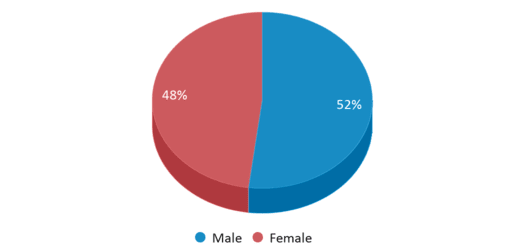
% Male | % Female
30% | 70%
52% | 48%
Total Classroom Teachers
24 teachers
82 teachers
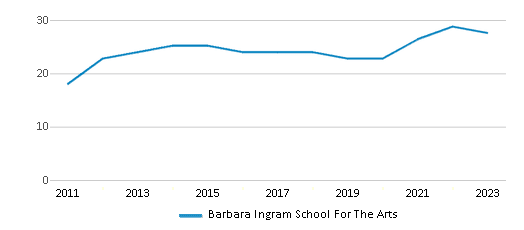
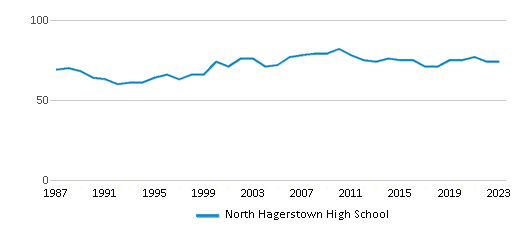
Student : Teacher Ratio
14:1
19:1
Test Scores
Overall Testing Rank
#210 out of 1347 schools in MD
(Top 20%)
(Top 20%)
#546 out of 1347 schools in MD
(Top 50%)
(Top 50%)
Math Test Scores (% Proficient)
30-34%
26%
Reading/Language Arts Test Scores (% Proficient)
80-84%
50%
Science Test Scores (% Proficient)
70-74%
25-29%
Graduation Rate
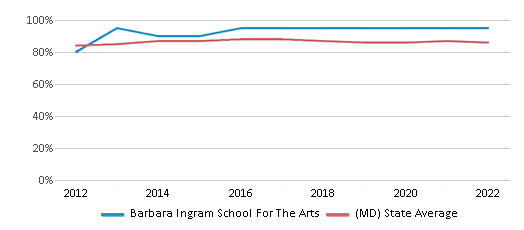
≥95%
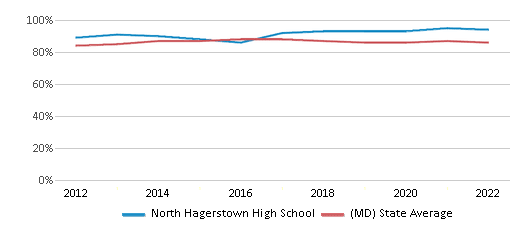
94%
Students by Grade
Students by Grade
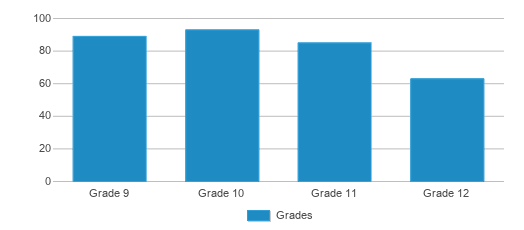
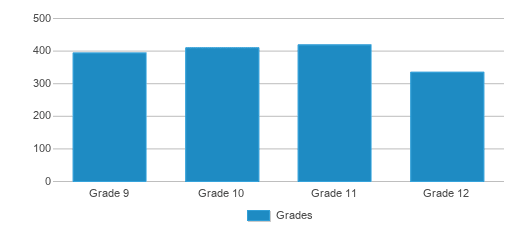
Grade 9 Students
89
394
Grade 10 Students
93
410
Grade 11 Students
85
419
Grade 12 Students
63
335
Students by Ethnicity
% American Indian
n/a
n/a
% Asian
5%
3%
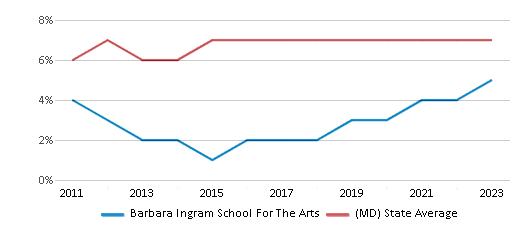
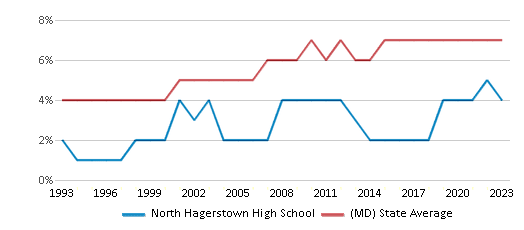
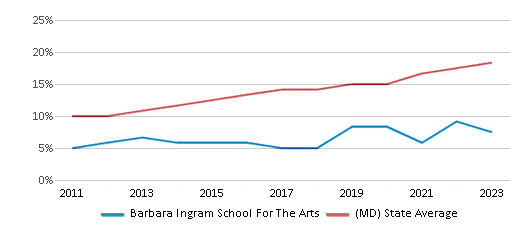
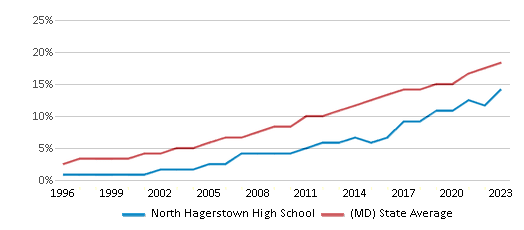
% Hispanic
12%
19%
% Black
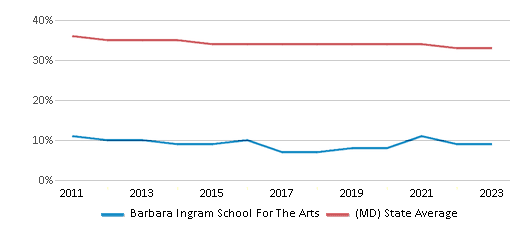
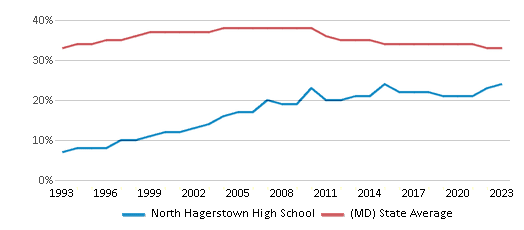
9%
23%
% White
68%
46%
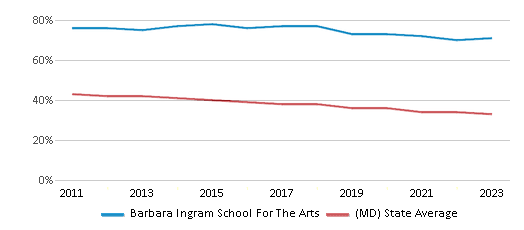
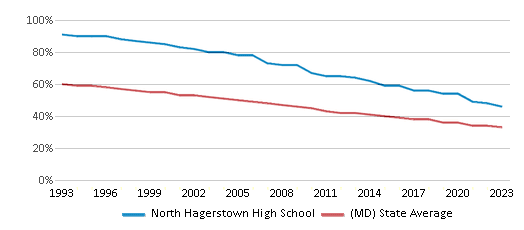
% Hawaiian
n/a
n/a
% Two or more races
6%
9%
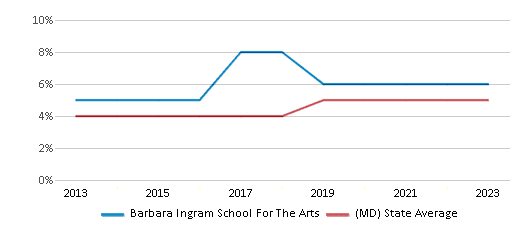
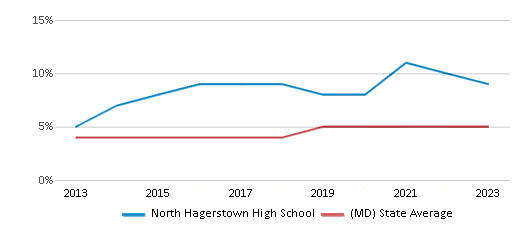
Diversity Score
0.51
0.70
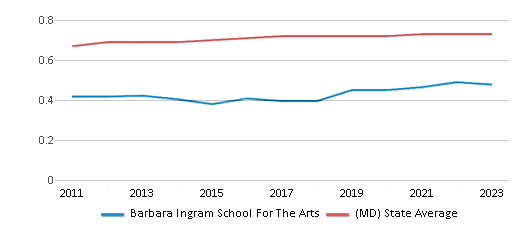
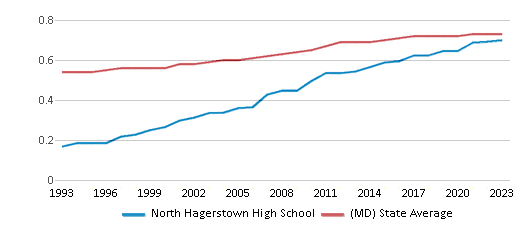
Additional Information
Eligible for Free Lunch
26%
53%
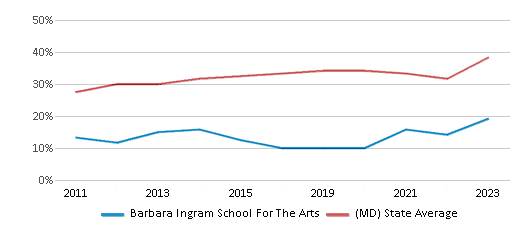
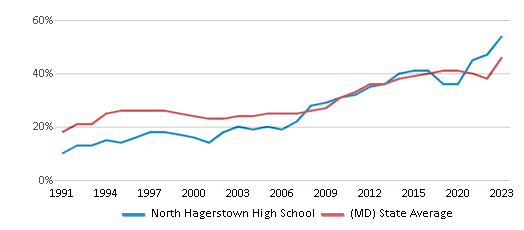
Eligible for Reduced Lunch
8%
10%
