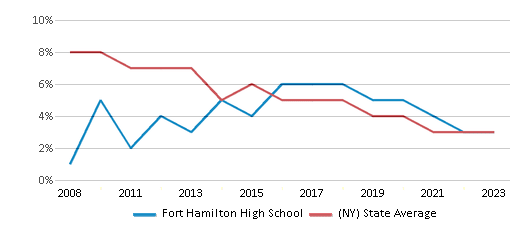
Brooklyn Theatre Arts High School vs. Fort Hamilton High School
Should you attend Brooklyn Theatre Arts High School or Fort Hamilton High School? Visitors to our site frequently compare these two schools. Compare their rankings, test scores, reviews and more to help you determine which school is the best choice for you.
School Overview
School
Top Rankings
Brooklyn Theatre Arts High School ranks among the top 20% of public schools in New York for:
Category
Attribute
Community Size
Fort Hamilton High School ranks among the top 20% of public schools in New York for:
Category
Attribute
Overall Rank
Math Proficiency
Reading/Language Arts Proficiency
Diversity
Overview
Serving 193 students in grades 9-12, Brooklyn Theatre Arts High School ranks in the bottom 50% of all schools in New York for overall test scores (math proficiency is top 50%, and reading proficiency is top 50%).
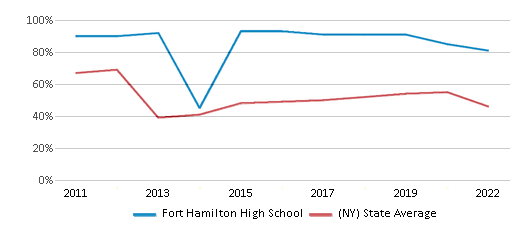
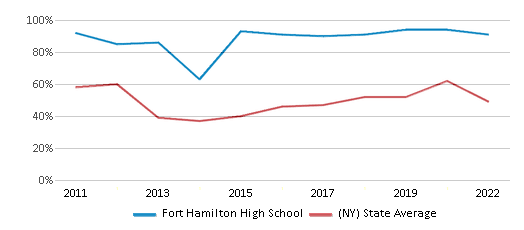
The percentage of students achieving proficiency in math is 40-59% (which is approximately equal to the New York state average of 46%). The percentage of students achieving proficiency in reading/language arts is ≤20% (which is lower than the New York state average of 49%).
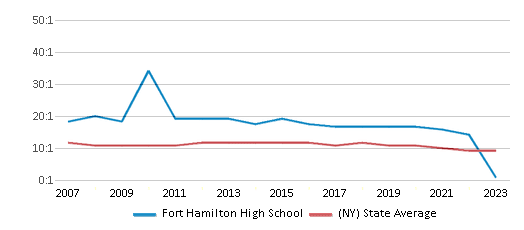
The student:teacher ratio of 12:1 is higher than the New York state level of 11:1.
Minority enrollment is 99% of the student body (majority Black), which is higher than the New York state average of 60% (majority Hispanic and Black).
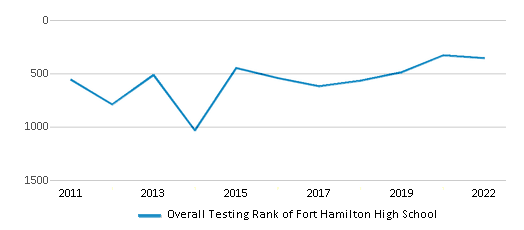
Serving 3,984 students in grades 9-12, Fort Hamilton High School ranks in the top 10% of all schools in New York for overall test scores (math proficiency is top 20%, and reading proficiency is top 20%).
The percentage of students achieving proficiency in math is 81% (which is higher than the New York state average of 46%). The percentage of students achieving proficiency in reading/language arts is 91% (which is higher than the New York state average of 49%).
The student:teacher ratio of 17:1 is higher than the New York state level of 11:1.
Minority enrollment is 66% of the student body (majority Hispanic and Asian), which is higher than the New York state average of 60% (majority Hispanic and Black).
Grades Offered
9-12
9-12
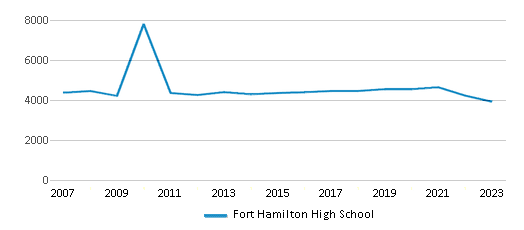
Total Students
193 students
3,984 students

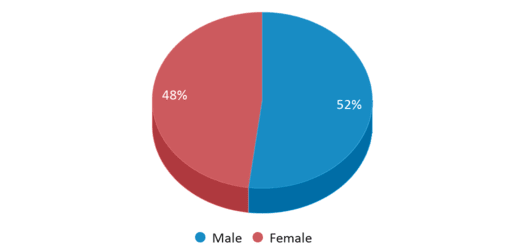
% Male | % Female
37% | 63%
52% | 48%

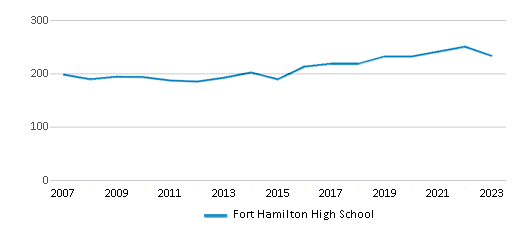
Total Classroom Teachers
16 teachers
237 teachers

Student : Teacher Ratio
12:1
17:1

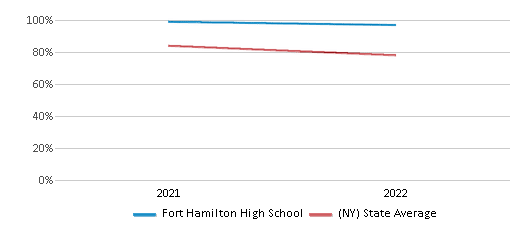
Test Scores
Overall Testing Rank
#3107 out of 4377 schools in NY
(Bottom 50%)
(Bottom 50%)
#356 out of 4377 schools in NY
(Top 10%)
(Top 10%)

Math Test Scores (% Proficient)
40-59%
81%

Reading/Language Arts Test Scores (% Proficient)
≤20%
91%

Science Test Scores (% Proficient)
80-89%
97%

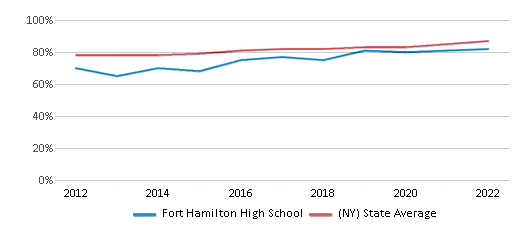
Graduation Rate
75-79%
82%

Students by Grade
Students by Grade

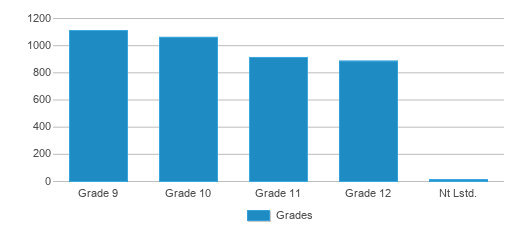
Grade 9 Students
56
1111
Grade 10 Students
50
1061
Grade 11 Students
43
913
Grade 12 Students
44
886
Ungraded Students
-
13
Students by Ethnicity
% American Indian
1%
n/a

n/a
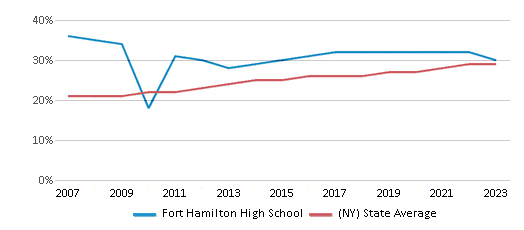
% Asian
n/a
30%

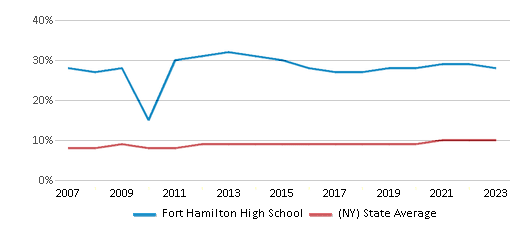
% Hispanic
13%
31%

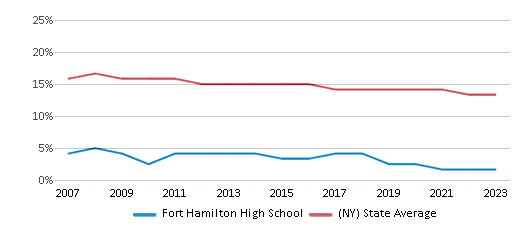
% Black
82%
3%

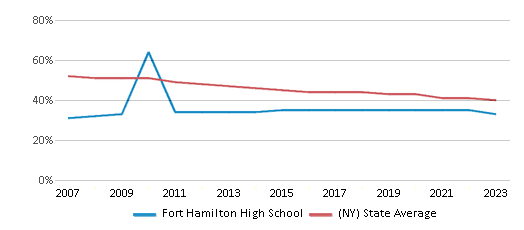
% White
1%
34%

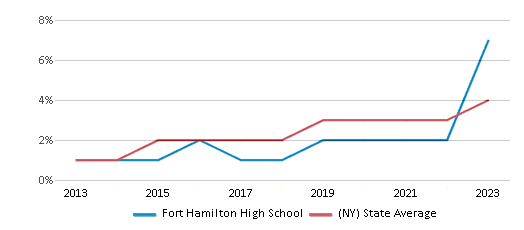
% Hawaiian
n/a
n/a
% Two or more races
3%
2%

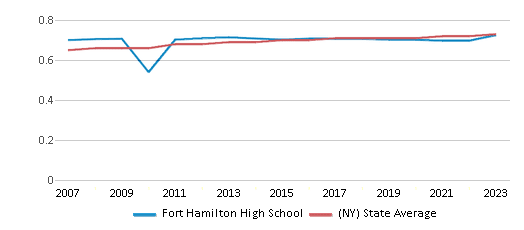
Diversity Score
0.31
0.70

Additional Information
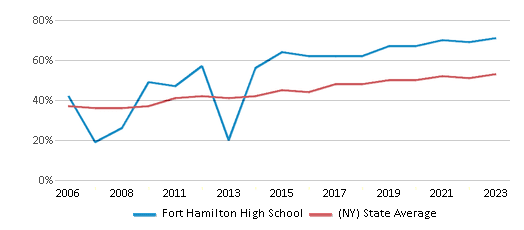
Eligible for Free Lunch
82%
73%

Eligible for Reduced Lunch
4%
4%

