Strom Thurmond High School vs. Fox Creek High School
Should you attend Strom Thurmond High School or Fox Creek High School? Visitors to our site frequently compare these two schools. Compare their rankings, test scores, reviews and more to help you determine which school is the best choice for you.
School Overview
School
Top Rankings
Strom Thurmond High School ranks among the top 20% of public schools in South Carolina for:
Category
Attribute
Reading/Language Arts Proficiency
Fox Creek High School ranks among the top 20% of public schools in South Carolina for:
Category
Attribute
Overall Rank
Reading/Language Arts Proficiency
Graduation Rate
Overview
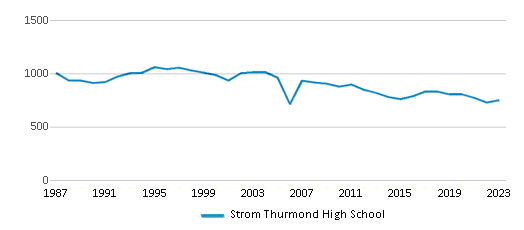
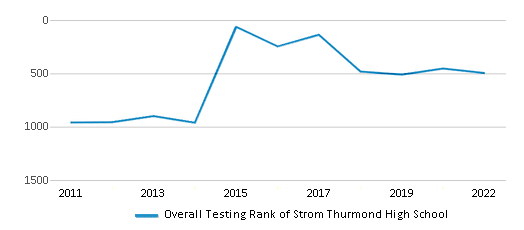
Serving 776 students in grades 9-12, Strom Thurmond High School ranks in the top 50% of all schools in South Carolina for overall test scores (math proficiency is bottom 50%, and reading proficiency is bottom 50%).
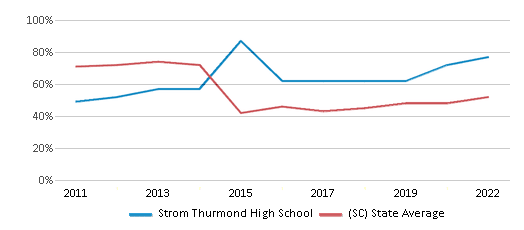
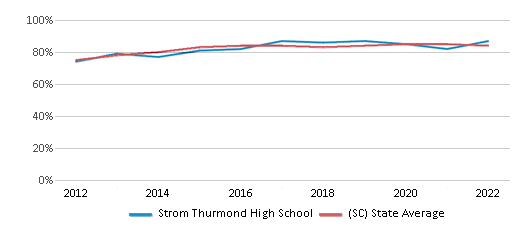
The percentage of students achieving proficiency in math is 25-29% (which is lower than the South Carolina state average of 41%). The percentage of students achieving proficiency in reading/language arts is 75-79% (which is higher than the South Carolina state average of 52%).
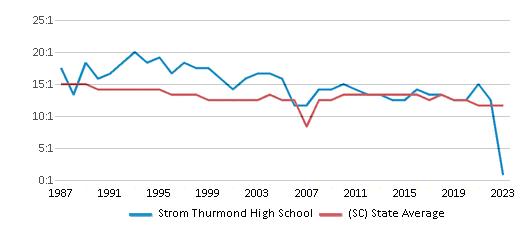
The student:teacher ratio of 17:1 is higher than the South Carolina state level of 14:1.
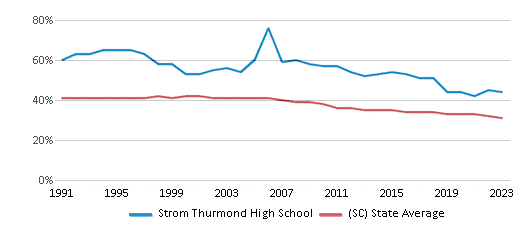
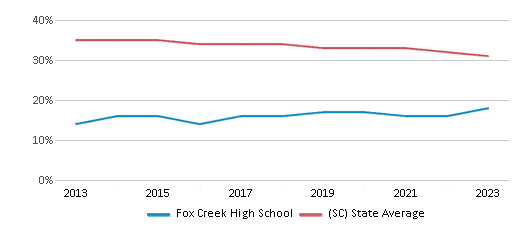
Minority enrollment is 57% of the student body (majority Black), which is higher than the South Carolina state average of 53% (majority Black).
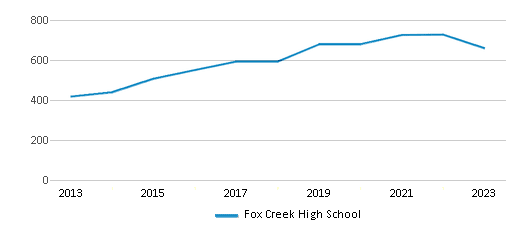
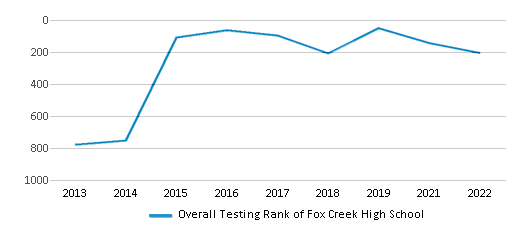
Serving 691 students in grades 9-12, Fox Creek High School ranks in the top 20% of all schools in South Carolina for overall test scores (math proficiency is top 50%, and reading proficiency is top 50%).
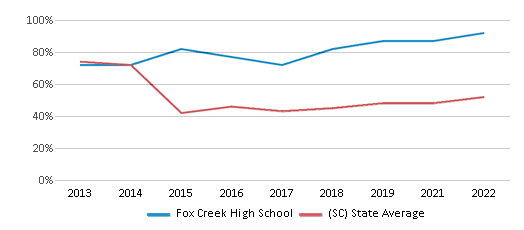
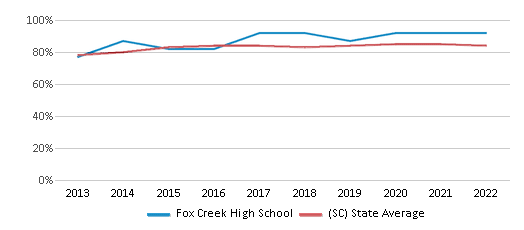
The percentage of students achieving proficiency in math is 45-49% (which is higher than the South Carolina state average of 41%). The percentage of students achieving proficiency in reading/language arts is 90-94% (which is higher than the South Carolina state average of 52%).
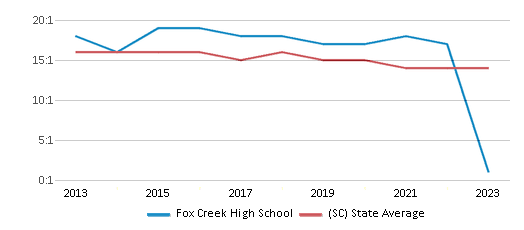
The student:teacher ratio of 17:1 is higher than the South Carolina state level of 14:1.
Minority enrollment is 28% of the student body (majority Black), which is lower than the South Carolina state average of 53% (majority Black).
Grades Offered
9-12
9-12
Total Students
776 students
691 students
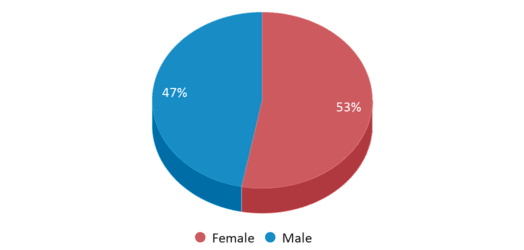
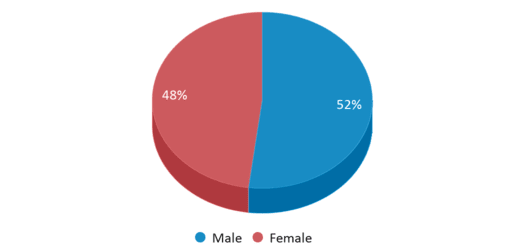
% Male | % Female
47% | 53%
52% | 48%
Total Classroom Teachers
46 teachers
41 teachers
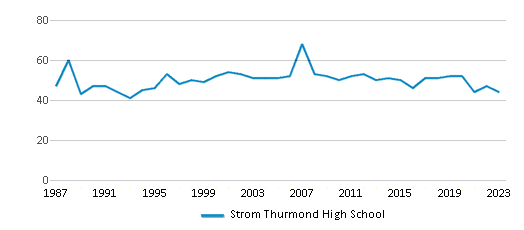
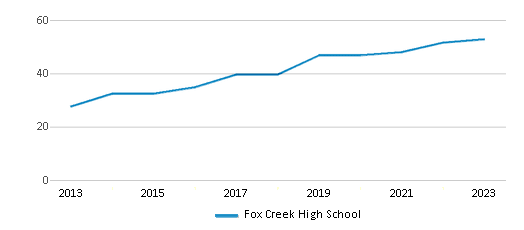
Student : Teacher Ratio
17:1
17:1
Test Scores
Overall Testing Rank
#495 out of 1154 schools in SC
(Top 50%)
(Top 50%)
#205 out of 1154 schools in SC
(Top 20%)
(Top 20%)
Math Test Scores (% Proficient)
25-29%
45-49%
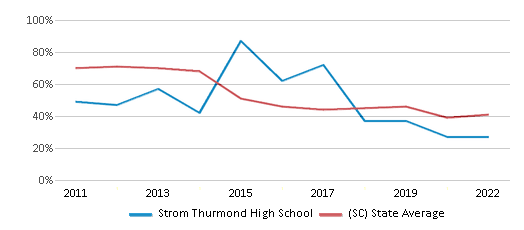
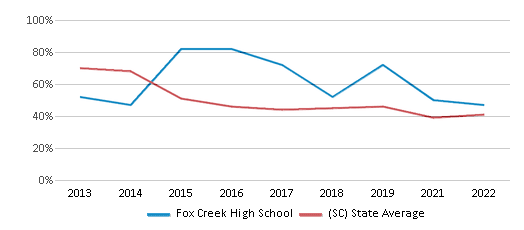
Reading/Language Arts Test Scores (% Proficient)
75-79%
90-94%
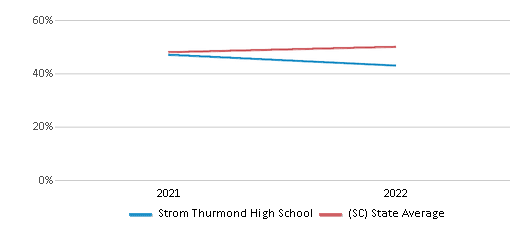
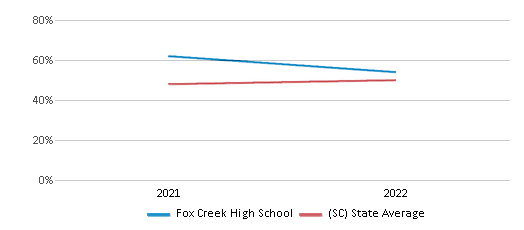
Science Test Scores (% Proficient)
43%
54%
Graduation Rate
85-89%
90-94%
Students by Grade
Students by Grade
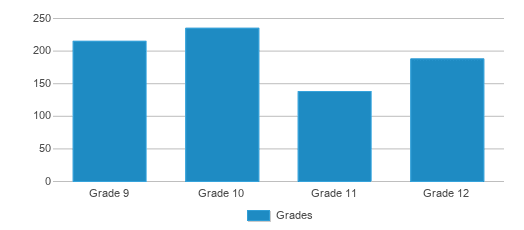
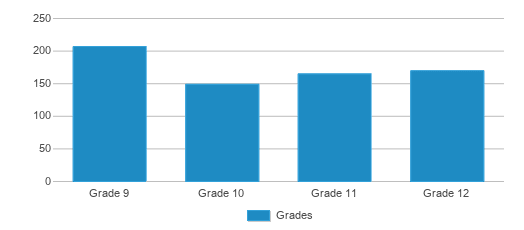
Grade 9 Students
215
207
Grade 10 Students
235
149
Grade 11 Students
138
165
Grade 12 Students
188
170
Students by Ethnicity
% American Indian
n/a
n/a
% Asian
1%
n/a
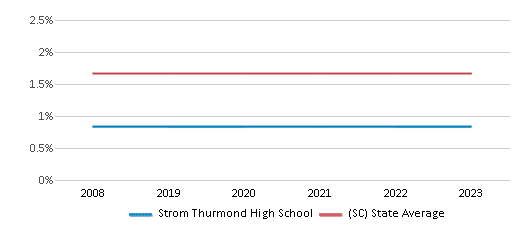
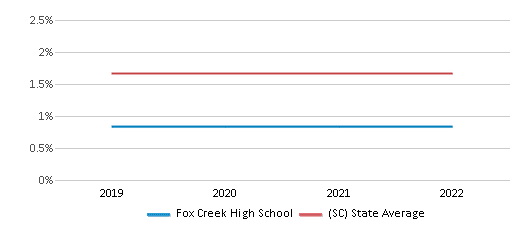
% Hispanic
9%
6%
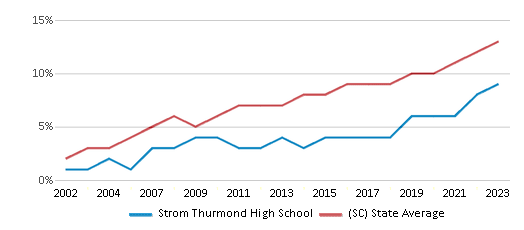
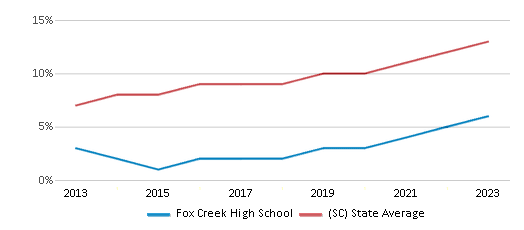
% Black
43%
16%
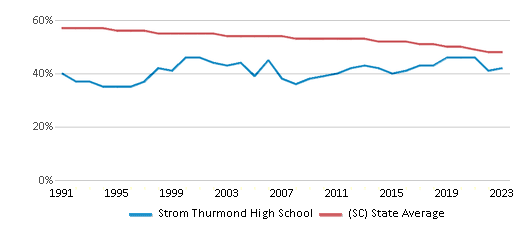
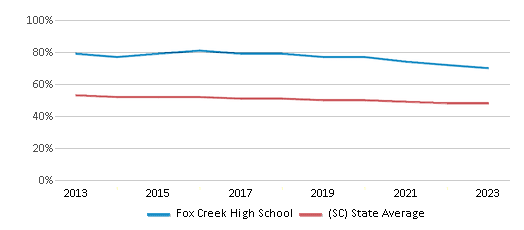
% White
43%
72%
% Hawaiian
n/a
n/a
% Two or more races
4%
6%
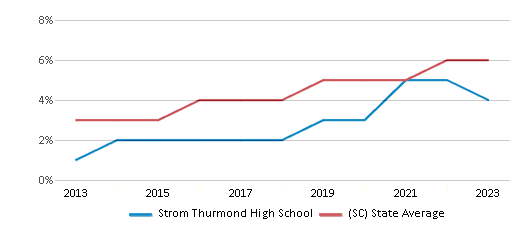
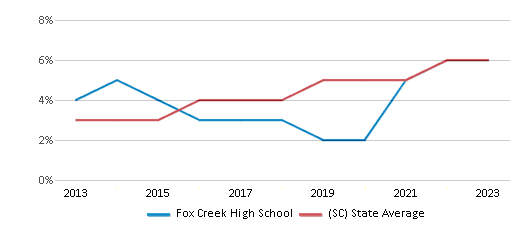
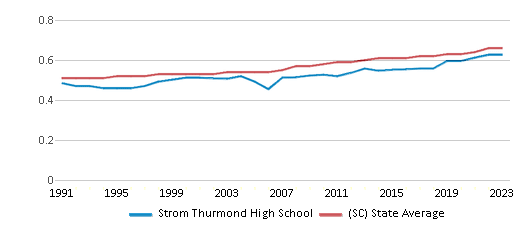
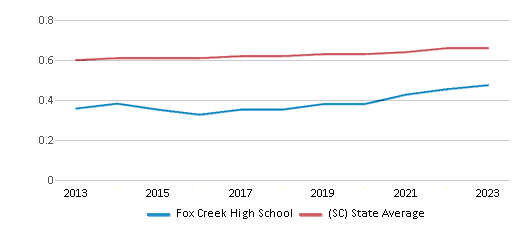
Diversity Score
0.63
0.45
Additional Information
Eligible for Free Lunch
64%
7%
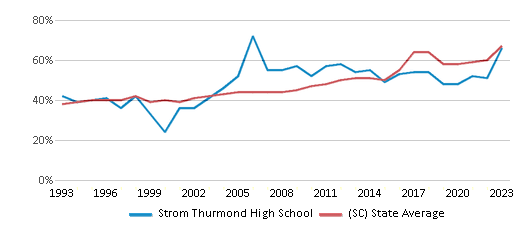
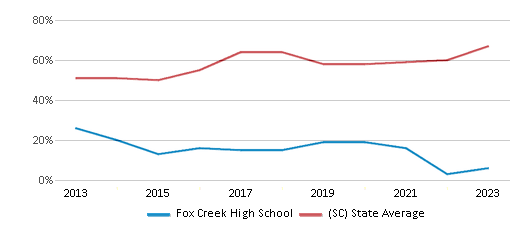
Eligible for Reduced Lunch
4%
2%
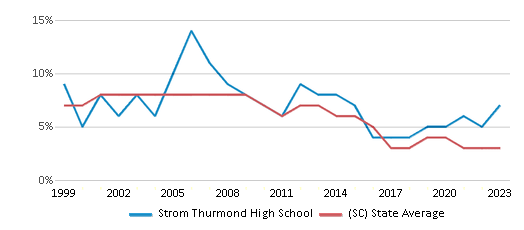
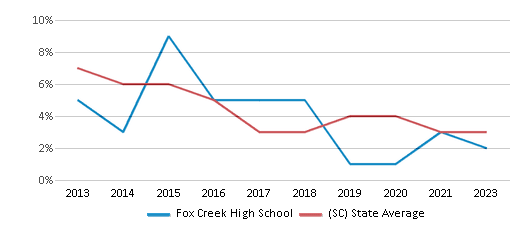
Sports
Total Sports Offered
n/a
13
Sports
n/a
Baseball, Basketball, Cheering, Dance, Football, Golf, Soccer, Softball, Swimming, Tennis, Volley Ball, Weightlifting, Wrestling
Extracurriculars
Total Extracurriculars
n/a
24
Extracurriculars
n/a
4-H Club, Academic Decathlon Team, Art Club, Astronomy Club, Chess Club, Debate Team, Fellowship of Christian Athletes, Future Business Leaders of America, Future Educators Association, Interact Club, Literary Magazine Club, National Honor Society, Photography Club, Poetry in Action Club, Poetry Out Loud Club, Prom Committee, Risk Club, SAT 1000 Club, School Newspaper, Spanish Club, Student Council, Students Against Destructive Decisions (SADD), Video Production Club, Yearbook Club
