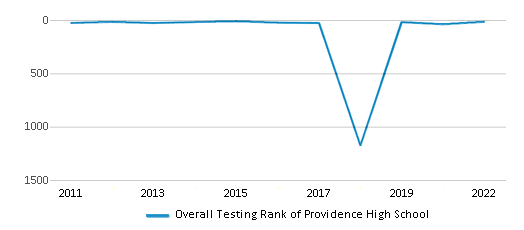
Serving 2,126 students in grades 9-12, Providence High School ranks in the top 1% of all schools in North Carolina for overall test scores (math proficiency is top 1%, and reading proficiency is top 1%).
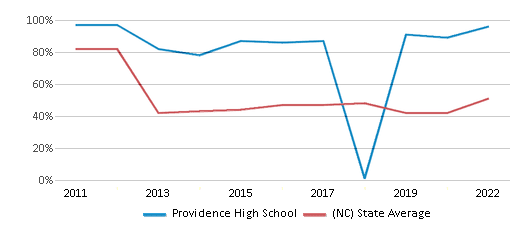
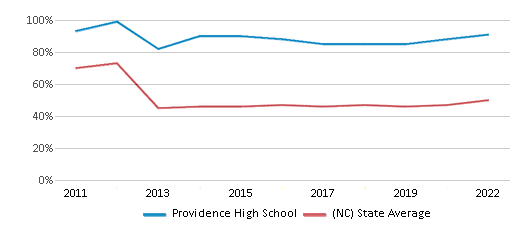
The percentage of students achieving proficiency in math is 96% (which is higher than the North Carolina state average of 51%). The percentage of students achieving proficiency in reading/language arts is 91% (which is higher than the North Carolina state average of 50%).
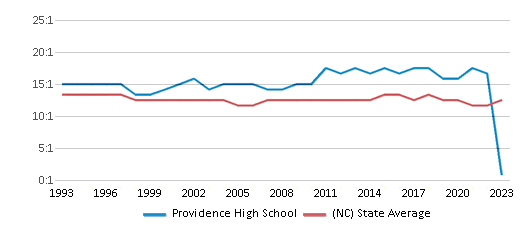
The student:teacher ratio of 21:1 is higher than the North Carolina state level of 15:1.
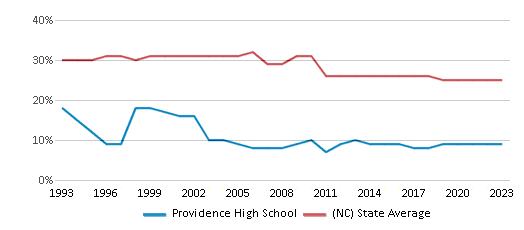
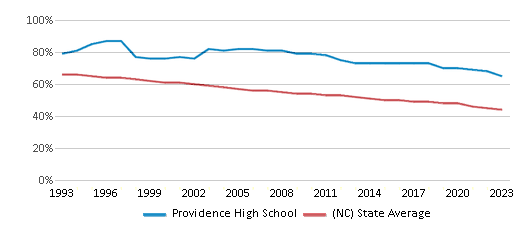
Minority enrollment is 38% of the student body (majority Asian and Hispanic), which is lower than the North Carolina state average of 57% (majority Black and Hispanic).
Quick Stats (2025)
- Grades: 9-12
- Enrollment: 2,126 students
- Student:Teacher Ratio: 21:1
- Minority Enrollment: 38%
- Graduation Rate: 97% (Top 5% in NC)
- Overall Testing Rank: Top 1%
- Math Proficiency: 96% (Top 1%)
- Reading Proficiency: 91% (Top 5%)
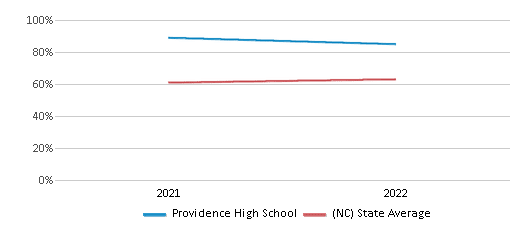
- Science Proficiency: 85% (Top 10%)
- Source: National Center for Education Statistics (NCES), NC Dept. of Education
Top Rankings
Providence High School ranks among the top 20% of public schools in North Carolina for:
Category
Attribute
Overall Rank
Math Proficiency
Reading/Language Arts Proficiency
Science Proficiency
Graduation Rate
School Overview
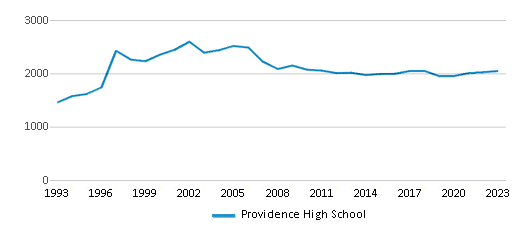
Providence High School's student population of 2,126 students has grown by 8% over five school years.
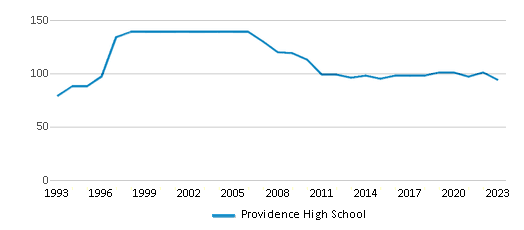
The teacher population of 100 teachers has stayed relatively flat over five school years.
Grades Offered
Grades 9-12
Total Students
2,126 students
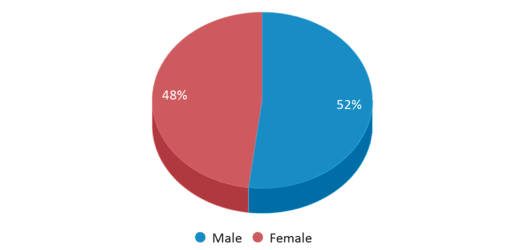
Gender %
Total Classroom Teachers
100 teachers
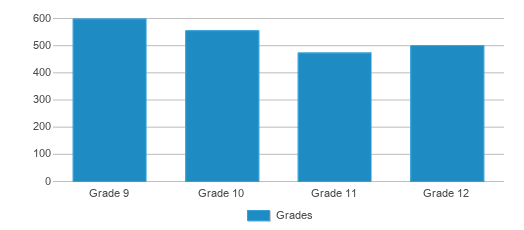
Students by Grade
School Rankings
Providence High School ranks within the top 1% of all 2,617 schools in North Carolina (based off of combined math and reading proficiency testing data).
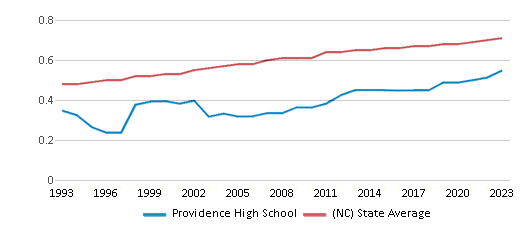
The diversity score of Providence High School is 0.58, which is less than the diversity score at state average of 0.71. The school's diversity has stayed relatively flat over five school years.
Overall Testing Rank
#15 out of 2617 schools
(Top 1%)
(Top 1%)
Math Test Scores (% Proficient)
96%
51%
Reading/Language Arts Test Scores (% Proficient)
91%
50%
Science Test Scores (% Proficient)
85%
63%
Student : Teacher Ratio
21:1
15:1
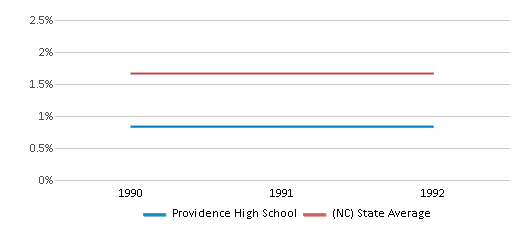
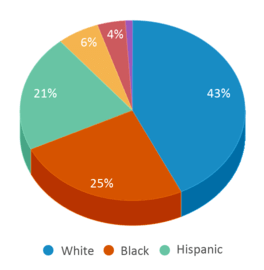
American Indian
n/a
1%
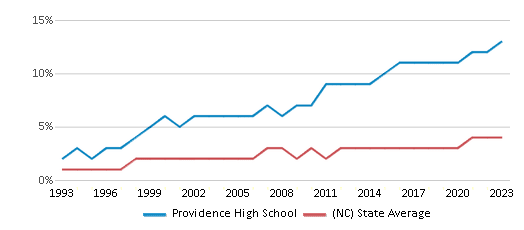
Asian
15%
4%
Hispanic
12%
21%
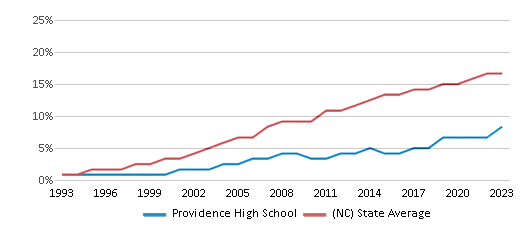
Black
8%
25%
White
62%
43%
Hawaiian
n/a
n/a
Two or more races
3%
6%
All Ethnic Groups
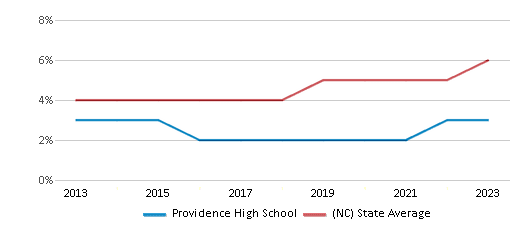
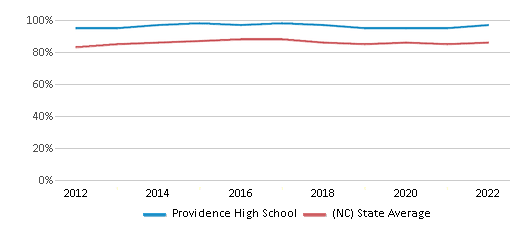
Graduation Rate
97%
86%
Participates in the National School Lunch Program (NSLP)
Yes
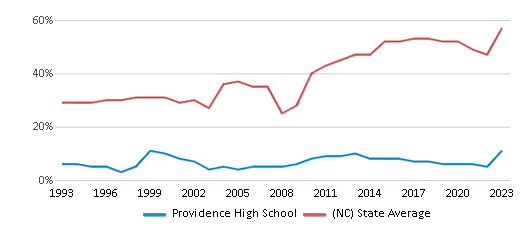
Eligible for Free Lunch
15%
68%
Eligible for Reduced Lunch
2%
1%
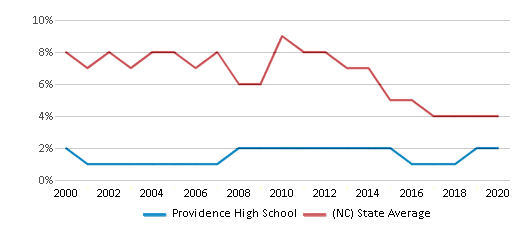
School Statewide Testing
School District Name
Source: National Center for Education Statistics (NCES), NC Dept. of Education
Frequently Asked Questions
What is Providence High School's ranking?
Providence High School is ranked #15 out of 2,617 schools, which ranks it among the top 1% of public schools in North Carolina.
What schools are Providence High School often compared to?
Providence High Schoolis often viewed alongside schools like Ardrey Kell High School by visitors of our site.
What percent of students have achieved state testing proficiency in math and reading?
96% of students have achieved math proficiency (compared to the 51% NC state average), while 91% of students have achieved reading proficiency (compared to the 50% NC state average).
What is the graduation rate of Providence High School?
The graduation rate of Providence High School is 97%, which is higher than the North Carolina state average of 86%.
How many students attend Providence High School?
2,126 students attend Providence High School.
What is the racial composition of the student body?
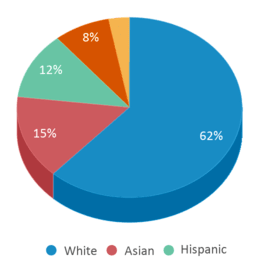
62% of Providence High School students are White, 15% of students are Asian, 12% of students are Hispanic, 8% of students are Black, and 3% of students are Two or more races.
What is the student:teacher ratio of Providence High School?
Providence High School has a student ration of 21:1, which is higher than the North Carolina state average of 15:1.
What grades does Providence High School offer ?
Providence High School offers enrollment in grades 9-12
What school district is Providence High School part of?
Providence High School is part of Charlotte-Mecklenburg Schools School District.
In what neighborhood is Providence High School located?
Providence High School is located in the Oxford Hunt neighborhood of Charlotte, NC.
School Reviews
4 2/15/2021
I'm a current sophomore at PHS. The teachers and classes are hit-or-miss. You'll find some teachers who are genuinely passionate about what they do, and others that don't care about the students at all. I've been lucky to have taken some amazing classes under instructors who fostered my love for learning, but I've also been in classes where it seemed as if the teacher's sole goal was to dent our GPAs and give busywork. For the most part, you'll find rigorous classes (there are plenty of APs). I personally don't love the social scene (there's plenty of drama, vaping, etc) but to each his own. When you take PE and health, be aware of the cockroaches (the pool is in the same building as the gym; that's why there are cockroaches). The other buildings are on the old side, but what else do you expect from a school constructed more than 30 years ago? Concerning clubs, it's fairly easy to join anything, but the administration is sus about letting students start clubs. I hope you have better luck with starting a club than I ever did. The Speech & Debate team is nationally ranked, and I know several people who qualify to nationals every year. The debate environment is a bit cliquey, but that's just my experience. Concerning PHS''s music department... I have no words. The prerequisites for the advanced music classes (think Wind Ensemble, AP Music Theory, etc) are a bit ridiculous. The must-not-be-named orchestra teacher is not pleasant. The orchestra teacher preaches empathy in SEL (Social Emotional Learning, required class for all students), but evidently doesn't practice it. I guess most teachers are over-worked, but maybe don't take it out on your students? The band teacher isn't much better. Sports are somewhat better - I've heard positive things about some coaches. I hope I don't come off as disappointed with my high school experience at PHS. I'm only a sophomore, and it hasn't been all that bad. However, I want to be realistic. Prospective students (I see your middle-schoolers!), please remember that high school forces you to grow up and mature. If you plan to take AP classes (besides psych lol), please remember to balance your mental health and your activities. PHS is rigorous, and you don't want to be doing schoolwork 24/7. Remember to do the normal high school things (once COVID-19 is over lol). Other than that, I've been satisfied with my experience at PHS.
2 10/5/2010
I'm currently a sophomore at Providence. The teachers are either extremely hard, or easy. There is no middle ground. There are too many people at Providence as well, forcing most kids to eat in the mall, which actually means we eat cramped on the floor. Everyone treats each other like mortal enemies, there are ridiculously high standards, and it's an extremely cliquey school. It's basically a private school, and economically, most students here are from very wealthy families- just count the number of Range Rovers in the parking lot.
Review Providence High School. Reviews should be a few sentences in length. Please include any comments on:
- Quality of academic programs, teachers, and facilities
- Availability of music, art, sports and other extracurricular activities
Recent Articles

What Is A Charter School?
Explore the world of charter schools in this comprehensive guide. Learn about their history, how they operate, and the pros and cons of this educational innovation. Discover key facts about charter schools, including admission policies, demographics, and funding, as well as what to look for when considering a charter school for your child.

10 Reasons Why High School Sports Benefit Students
Discover the 10 compelling reasons why high school sports are beneficial for students. This comprehensive article explores how athletics enhance academic performance, foster personal growth, and develop crucial life skills. From improved fitness and time management to leadership development and community representation, learn why participating in high school sports can be a game-changer for students' overall success and well-being.

February 05, 2025
Understanding the U.S. Department of Education: Structure, Impact, and EvolutionWe explore how the Department of Education shapes American education, from its cabinet-level leadership to its impact on millions of students, written for general audiences seeking clarity on this vital institution.


