Serving 117 students in grades 7-12, Tehama Elearning Academy ranks in the bottom 50% of all schools in California for overall test scores (math proficiency is bottom 50%, and reading proficiency is bottom 50%).
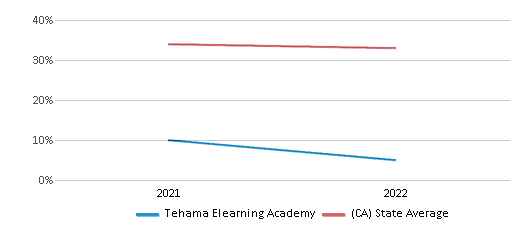
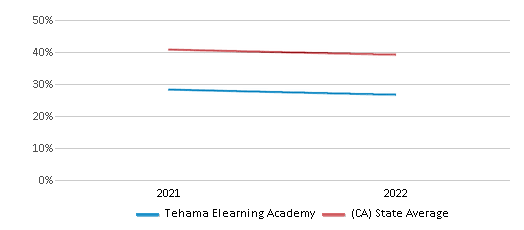
The percentage of students achieving proficiency in math is ≤5% (which is lower than the California state average of 33%). The percentage of students achieving proficiency in reading/language arts is 30-34% (which is lower than the California state average of 47%).
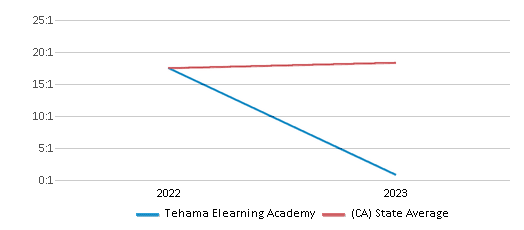
The student:teacher ratio of 29:1 is higher than the California state level of 21:1.
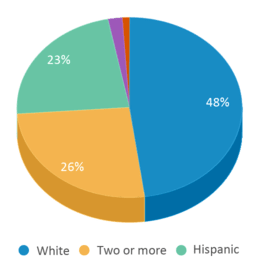
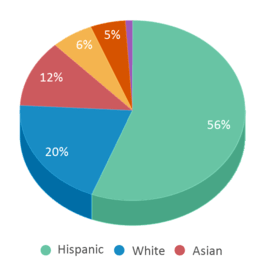
Minority enrollment is 52% of the student body (majority Hispanic), which is lower than the California state average of 80% (majority Hispanic).
Quick Stats (2025)
- School Type: Online School/Charter School
- Grades: 7-12
- Enrollment: 117 students
- State Accredited: No
- Live Instruction: No
- Rolling Enrollment: No
- Student:Teacher Ratio: 29:1
- Minority Enrollment: 52%
- Graduation Rate: ≥90% (Top 50% in CA)
- Overall Testing Rank: Bottom 50%
- Math Proficiency: ≤5% (Btm 50%)
- Reading Proficiency: 30-34% (Btm 50%)
- Science Proficiency: ≤20% (Btm 50%)
- Source: National Center for Education Statistics (NCES), CA Dept. of Education
Top Rankings
Tehama Elearning Academy ranks among the top 20% of public schools in California for:
Category
Attribute
Community Size
School Overview
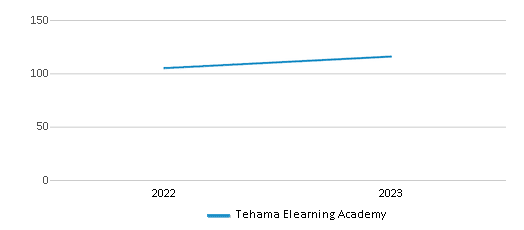
Tehama Elearning Academy's student population of 117 students has grown by 11% over five school years.
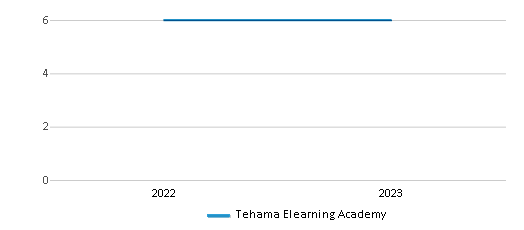
The teacher population of 4 teachers has declined by 20% over five school years.
School Type
Grades Offered
Grades 7-12
Total Students
117 students
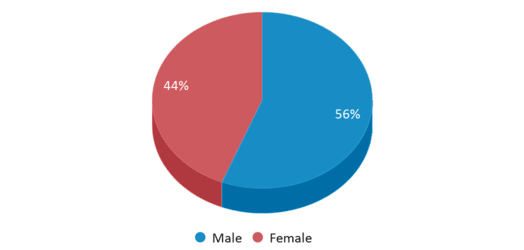
Gender %
Total Classroom Teachers
4 teachers
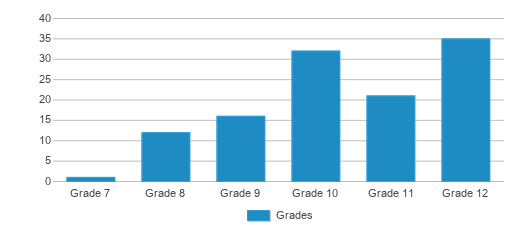
Students by Grade
State Accredited Program
No
Personalized Content
No
Live Instruction
No
Rolling Enrollment
No
Flexible Class Schedule
No
Accelerated Offerings
No
Classes for Credit/Part Time Options
No
Dedicated College Counselor
No
Tutoring/Mentoring
No
Community Clubs/Activities Offered
No
School Calendar
School Rankings
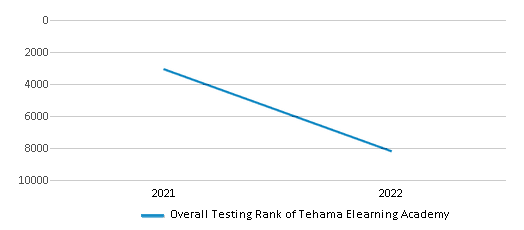
Tehama Elearning Academy ranks within the bottom 50% of all 9,602 schools in California (based off of combined math and reading proficiency testing data).
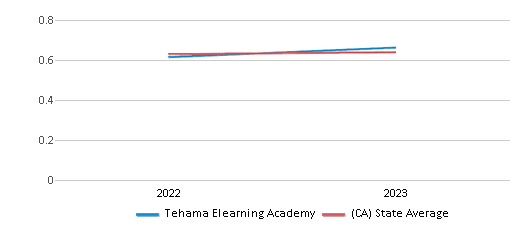
The diversity score of Tehama Elearning Academy is 0.66, which is more than the diversity score at state average of 0.63. The school's diversity has stayed relatively flat over five school years.
Overall Testing Rank
#8199 out of 9602 schools
(Bottom 50%)
(Bottom 50%)
Math Test Scores (% Proficient)
≤5%
33%
Reading/Language Arts Test Scores (% Proficient)
30-34%
47%
Science Test Scores (% Proficient)
≤20%
29%
Student : Teacher Ratio
29:1
21:1
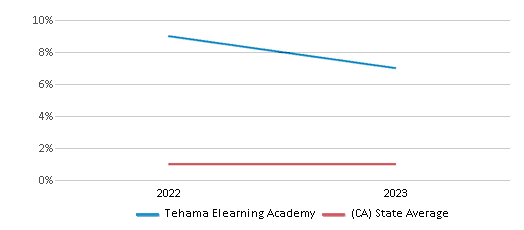
American Indian
2%
1%
Asian
n/a
12%
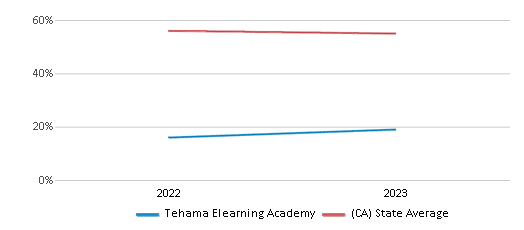
Hispanic
23%
56%
Black
1%
5%
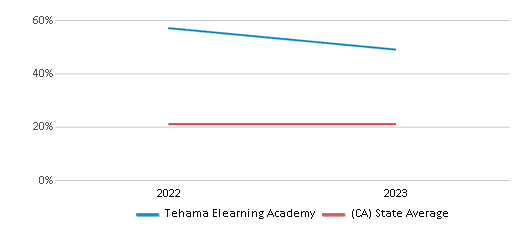
White
48%
20%
Hawaiian
n/a
n/a
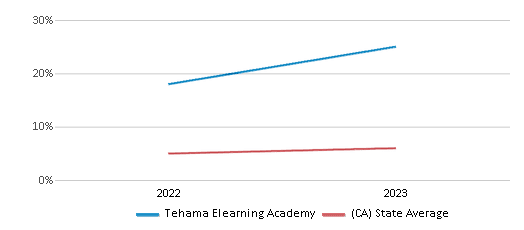
Two or more races
26%
6%
All Ethnic Groups
Graduation Rate
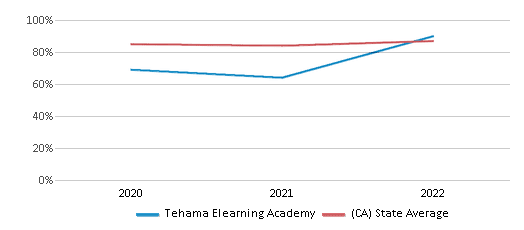
≥90%
87%
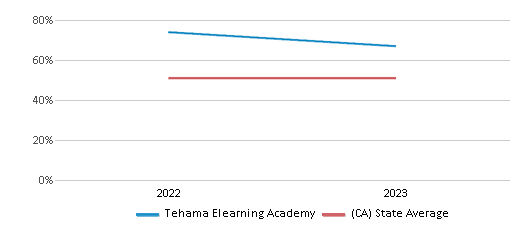
Eligible for Free Lunch
73%
54%
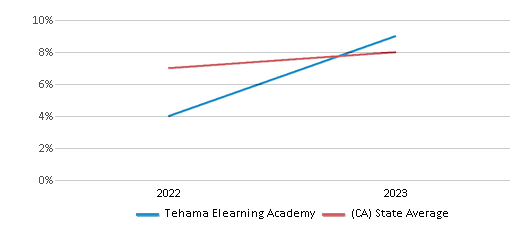
Eligible for Reduced Lunch
8%
8%
School Statewide Testing
School District Name
Source: National Center for Education Statistics (NCES), CA Dept. of Education
School Notes
PRINCIPAL'S MESSAGE
PRINCIPAL'S MESSAGE
Greetings, and Welcome to Tehama eLearning Academy!
As a "Blended Model" school in California offering both on-site and online learning opportunities, we have dynamic and engaging programs that set us apart from the traditional public school. Not only do we excel in the delivery of online academics, but we also provide many on-site offerings:
Come and find out what makes TeLA such an exciting alternative.
Michelle Barnard
Principal
A BLENDED ACADEMIC MODEL
The intent of the school is to use computers and associated technology as instructional tools, allowing students to complete their online coursework from anywhere they can access the Internet. Additionally, a more traditional approach to instruction takes place at the Red Bluff location, including language arts, math, science, personalized tutoring, and electives. This blended academic model, which includes both online and onsite learning, allows each student to achieve a more complete education through a custom-designed model of instruction based on their own needs. We offer a full range of online academic courses, for students enrolled in grades seven through adult. Students who live in Tehama and the five adjacent counties are eligible to enroll.
Our target is any student who can benefit most from a self-paced, personalized instruction that is delivered on site or in the home via technology. We believe that, given a comprehensive and mastery-based curriculum, high expectations, access to technology (computer and Internet), strong instructional support, guidance from experienced teachers, a strong commitment from parents (or other caring adults), and a well-conceived virtual education program can help boost student achievement, serve the unique needs of students and families, and offer a new model for effective public education in the 21st century.
PRINCIPAL'S MESSAGE
Greetings, and Welcome to Tehama eLearning Academy!
As a "Blended Model" school in California offering both on-site and online learning opportunities, we have dynamic and engaging programs that set us apart from the traditional public school. Not only do we excel in the delivery of online academics, but we also provide many on-site offerings:
- core academic intervention
- tutoring
- fine arts electives
Come and find out what makes TeLA such an exciting alternative.
Michelle Barnard
Principal
A BLENDED ACADEMIC MODEL
The intent of the school is to use computers and associated technology as instructional tools, allowing students to complete their online coursework from anywhere they can access the Internet. Additionally, a more traditional approach to instruction takes place at the Red Bluff location, including language arts, math, science, personalized tutoring, and electives. This blended academic model, which includes both online and onsite learning, allows each student to achieve a more complete education through a custom-designed model of instruction based on their own needs. We offer a full range of online academic courses, for students enrolled in grades seven through adult. Students who live in Tehama and the five adjacent counties are eligible to enroll.
Our target is any student who can benefit most from a self-paced, personalized instruction that is delivered on site or in the home via technology. We believe that, given a comprehensive and mastery-based curriculum, high expectations, access to technology (computer and Internet), strong instructional support, guidance from experienced teachers, a strong commitment from parents (or other caring adults), and a well-conceived virtual education program can help boost student achievement, serve the unique needs of students and families, and offer a new model for effective public education in the 21st century.
Profile last updated: 02/09/2025
Frequently Asked Questions
What is Tehama Elearning Academy's ranking?
Tehama Elearning Academy is ranked #8199 out of 9,602 schools, which ranks it among the bottom 50% of public schools in California.
What percent of students have achieved state testing proficiency in math and reading?
≤5% of students have achieved math proficiency (compared to the 33% CA state average), while 30-34% of students have achieved reading proficiency (compared to the 47% CA state average).
What is the graduation rate of Tehama Elearning Academy?
The graduation rate of Tehama Elearning Academy is 90%, which is higher than the California state average of 87%.
How many students attend Tehama Elearning Academy?
117 students attend Tehama Elearning Academy.
What is the racial composition of the student body?
48% of Tehama Elearning Academy students are White, 26% of students are Two or more races, 23% of students are Hispanic, 2% of students are American Indian, and 1% of students are Black.
What is the student:teacher ratio of Tehama Elearning Academy?
Tehama Elearning Academy has a student ration of 29:1, which is higher than the California state average of 21:1.
What grades does Tehama Elearning Academy offer ?
Tehama Elearning Academy offers enrollment in grades 7-12
What school district is Tehama Elearning Academy part of?
Tehama Elearning Academy is part of Tehama Elearning Academy School District.
School Reviews
5 11/8/2022
TeLA is a great school with great opportunities. I've seen so many students thrive there, making progress that seemed nearly impossible to them elsewhere. Learning is incredibly personalized and flexible, and the in-person elective offerings are fantastic. Plenty of field trips and college options were discussed too!
Review Tehama Elearning Academy. Reviews should be a few sentences in length. Please include any comments on:
- Quality of academic programs, teachers, and facilities
- Availability of music, art, sports and other extracurricular activities
Recent Articles

What Is A Charter School?
Explore the world of charter schools in this comprehensive guide. Learn about their history, how they operate, and the pros and cons of this educational innovation. Discover key facts about charter schools, including admission policies, demographics, and funding, as well as what to look for when considering a charter school for your child.

10 Reasons Why High School Sports Benefit Students
Discover the 10 compelling reasons why high school sports are beneficial for students. This comprehensive article explores how athletics enhance academic performance, foster personal growth, and develop crucial life skills. From improved fitness and time management to leadership development and community representation, learn why participating in high school sports can be a game-changer for students' overall success and well-being.

February 05, 2025
Understanding the U.S. Department of Education: Structure, Impact, and EvolutionWe explore how the Department of Education shapes American education, from its cabinet-level leadership to its impact on millions of students, written for general audiences seeking clarity on this vital institution.


