Top Rankings
Killeen Independent School District ranks among the top 20% of public school district in Texas for:
Category
Attribute
Diversity
Most diverse schools (Top 1%)
Community Size
Largest student body (number of students) (Top 1%)
For the 2025 school year, there are 58 public schools serving 43,864 students in Killeen Independent School District. This district's average testing ranking is 4/10, which is in the bottom 50% of public schools in Texas.
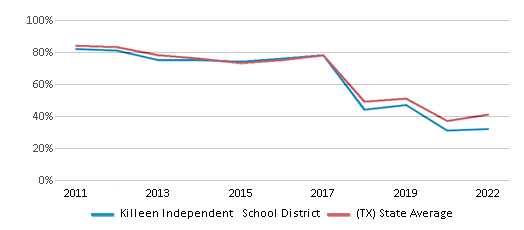
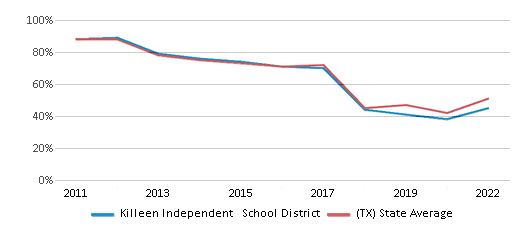
Public Schools in Killeen Independent School District have an average math proficiency score of 32% (versus the Texas public school average of 41%), and reading proficiency score of 45% (versus the 51% statewide average).
Minority enrollment is 83% of the student body (majority Hispanic and Black), which is more than the Texas public school average of 75% (majority Hispanic).
Overview
This School District
This State (TX)
# Schools
58 Schools
9,320 Schools
# Students
43,864 Students
5,529,984 Students
# Teachers
2,785 Teachers
374,844 Teachers
Student : Teacher Ratio
16:1
16:1
District Rank
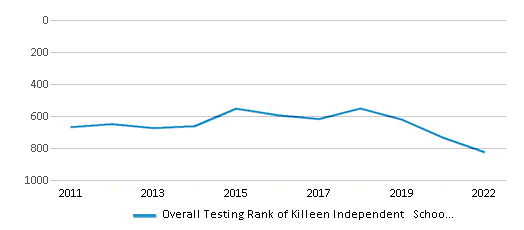
Killeen Independent School District, which is ranked #834 of all 1,196 school districts in Texas (based off of combined math and reading proficiency testing data) for the 2021-2022 school year.
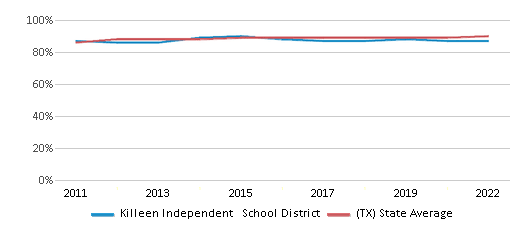
The school district's graduation rate of 87% has decreased from 88% over five school years.
Overall District Rank
#826 out of 1204 school districts
(Bottom 50%)
(Bottom 50%)
Math Test Scores (% Proficient)
32%
41%
Reading/Language Arts Test Scores (% Proficient)
45%
51%
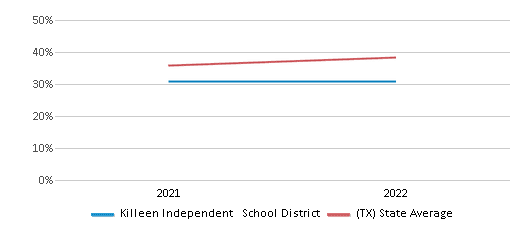
Science Test Scores (% Proficient)
37%
46%
Graduation Rate
87%
90%
Students by Ethnicity:
Diversity Score
0.74
0.64
# American Indian Students
193 Students
17,916 Students
% American Indian Students
1%
n/a
# Asian Students
967 Students
296,049 Students
% Asian Students
2%
6%
# Hispanic Students
15,072 Students
2,942,422 Students
% Hispanic Students
34%
53%
# Black Students
14,676 Students
706,008 Students
% Black Students
34%
13%
# White Students
7,643 Students
1,384,941 Students
% White Students
17%
25%
# Hawaiian Students
906 Students
8,841 Students
% Hawaiian Students
2%
n/a
# Two or more races Students
4,407 Students
173,807 Students
% of Two or more races Students
10%
3%
Students by Grade:
# Students in PK Grade:
2,899
275,832
# Students in K Grade:
3,164
361,958
# Students in 1st Grade:
3,539
385,427
# Students in 2nd Grade:
3,413
402,148
# Students in 3rd Grade:
3,429
399,623
# Students in 4th Grade:
3,311
398,690
# Students in 5th Grade:
3,236
399,071
# Students in 6th Grade:
3,137
402,143
# Students in 7th Grade:
3,031
406,424
# Students in 8th Grade:
2,888
414,179
# Students in 9th Grade:
3,493
472,263
# Students in 10th Grade:
3,164
438,622
# Students in 11th Grade:
2,723
406,207
# Students in 12th Grade:
2,437
367,397
# Ungraded Students:
-
-
District Revenue and Spending
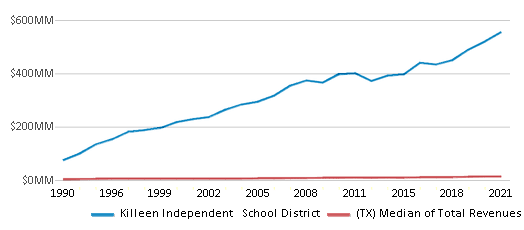
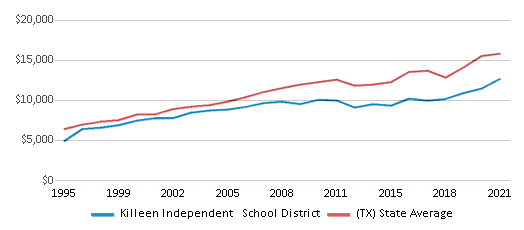
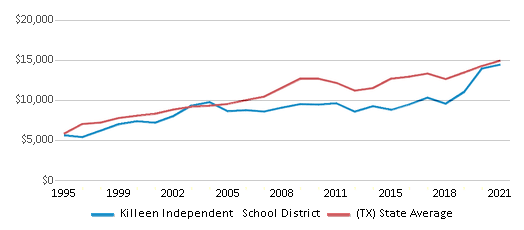
The revenue/student of $12,652 in this school district is less than the state median of $13,387. The school district revenue/student has stayed relatively flat over four school years.
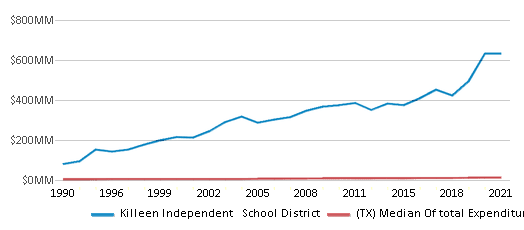
The school district's spending/student of $14,438 is higher than the state median of $14,116. The school district spending/student has stayed relatively flat over four school years.
Total Revenue
$555 MM
$74,029 MM
Spending
$633 MM
$78,063 MM
Revenue / Student
$12,652
$13,387
Spending / Student
$14,438
$14,116
Best Killeen Independent School District Public Schools (2025)
School
(Math and Reading Proficiency)
(Math and Reading Proficiency)
Location
Grades
Students
Rank: #11.
Killeen Isd Early College High School
(Math: 60% | Reading: 82%)
Rank:
Rank:
10/
Top 10%10
51000 Tank Destroyer Blvd
Fort Hood, TX 76544
(254) 336-0260
Fort Hood, TX 76544
(254) 336-0260
Grades: 9-12
| 1,030 students
Rank: #22.
Skipcha Elementary School
(Math: 57% | Reading: 62%)
Rank:
Rank:
9/
Top 20%10
515 Prospector Trl
Harker Heights, TX 76548
(254) 336-6690
Harker Heights, TX 76548
(254) 336-6690
Grades: PK-5
| 968 students
Rank: #33.
Richard E Cavazos Elementary School
(Math: 52% | Reading: 59%)
Rank:
Rank:
8/
Top 30%10
1200 N 10th St
Nolanville, TX 76559
(254) 336-7000
Nolanville, TX 76559
(254) 336-7000
Grades: PK-5
| 550 students
Rank: #44.
Montague Village Elementary School
(Math: 50-54% | Reading: 55-59%)
Rank:
Rank:
8/
Top 30%10
84001 Clements Dr
Fort Hood, TX 76544
(254) 336-2230
Fort Hood, TX 76544
(254) 336-2230
Grades: PK-5
| 564 students
Rank: #55.
Maude Moore Wood Elementary School
(Math: 47% | Reading: 60%)
Rank:
Rank:
8/
Top 30%10
6410 Morganite Ln
Killeen, TX 76542
(254) 336-1650
Killeen, TX 76542
(254) 336-1650
Grades: PK-5
| 696 students
Rank: #66.
Dr Joseph A Fowler Elementary School
(Math: 48% | Reading: 57%)
Rank:
Rank:
8/
Top 30%10
4910 Katy Creek Ln
Killeen, TX 76549
(254) 336-1760
Killeen, TX 76549
(254) 336-1760
Grades: PK-5
| 783 students
Rank: #77.
Nolanville Elementary School
(Math: 47% | Reading: 57%)
Rank:
Rank:
8/
Top 30%10
901 Old Nolanville Rd
Nolanville, TX 76559
(254) 336-2180
Nolanville, TX 76559
(254) 336-2180
Grades: PK-5
| 640 students
Rank: #88.
Cedar Valley Elementary School
(Math: 37% | Reading: 62%)
Rank:
Rank:
7/
Top 50%10
4801 Chantz Dr
Killeen, TX 76542
(254) 336-1480
Killeen, TX 76542
(254) 336-1480
Grades: PK-5
| 594 students
Rank: #99.
Saegert Elementary School
(Math: 41% | Reading: 57%)
Rank:
Rank:
7/
Top 50%10
5600 Schorn Dr
Killeen, TX 76542
(254) 336-6660
Killeen, TX 76542
(254) 336-6660
Grades: PK-5
| 982 students
Rank: #1010.
Harker Heights Elementary School
(Math: 45% | Reading: 53%)
Rank:
Rank:
7/
Top 50%10
726 S Ann Blvd
Harker Heights, TX 76548
(254) 336-2050
Harker Heights, TX 76548
(254) 336-2050
Grades: PK-5
| 720 students
Rank: #1111.
Meadows Elementary School
(Math: 39% | Reading: 59%)
Rank:
Rank:
7/
Top 50%10
423 27th St
Fort Hood, TX 76544
(254) 336-1870
Fort Hood, TX 76544
(254) 336-1870
Grades: PK-5
| 864 students
Rank: #12 - 1312. - 13.
Gateway High School
Alternative School
(Math: <50% | Reading: <50%)
Rank:
Rank:
7/
Top 50%10
4100 Zephyr Rd
Killeen, TX 76543
(254) 336-1700
Killeen, TX 76543
(254) 336-1700
Grades: 9-12
| 97 students
Rank: #12 - 1312. - 13.
Killeen Isd Career Center
(Math: <50% | Reading: <50%)
Rank:
Rank:
7/
Top 50%10
1320 Stagecoach Rd
Killeen, TX 76542
(254) 336-3800
Killeen, TX 76542
(254) 336-3800
Grades: 9-12
| n/a students
Rank: #1414.
Nolan Middle School
(Math: 43% | Reading: 53%)
Rank:
Rank:
7/
Top 50%10
1600 Warriors Path Rd
Harker Heights, TX 76548
(254) 336-1150
Harker Heights, TX 76548
(254) 336-1150
Grades: 6-8
| 1,156 students
Rank: #1515.
Clarke Elementary School
(Math: 40-44% | Reading: 50-54%)
Rank:
Rank:
6/
Top 50%10
51600 Commanche Ave
Fort Hood, TX 76544
(254) 336-1510
Fort Hood, TX 76544
(254) 336-1510
Grades: PK-3
| 515 students
Rank: #1616.
Oveta Culp Hobby Elementary School
(Math: 35-39% | Reading: 55-59%)
Rank:
Rank:
6/
Top 50%10
53210 Lost Moccasin
Fort Hood, TX 76544
(254) 336-6500
Fort Hood, TX 76544
(254) 336-6500
Grades: PK-3
| 786 students
Rank: #1717.
Clear Creek Elementary School
(Math: 40% | Reading: 53%)
Rank:
Rank:
6/
Top 50%10
4800 Washington St
Fort Hood, TX 76544
(254) 336-1550
Fort Hood, TX 76544
(254) 336-1550
Grades: PK-5
| 781 students
Rank: #1818.
Union Grove Middle School
(Math: 39% | Reading: 50%)
Rank:
Rank:
6/
Top 50%10
101 E Iowa Dr
Harker Heights, TX 76548
(254) 336-6580
Harker Heights, TX 76548
(254) 336-6580
Grades: 6-8
| 669 students
Rank: #1919.
Alice W Douse Elementary School
(Math: 36% | Reading: 52%)
Rank:
Rank:
6/
Top 50%10
700 Rebecca Lynn Ln
Killeen, TX 76542
(254) 336-7480
Killeen, TX 76542
(254) 336-7480
Grades: PK-5
| 929 students
Rank: #2020.
Ira Cross Jr Elementary School
(Math: 41% | Reading: 47%)
Rank:
Rank:
5/
Bottom 50%10
1910 Herndon Dr
Killeen, TX 76543
(254) 336-2550
Killeen, TX 76543
(254) 336-2550
Grades: PK-5
| 647 students
Rank: #2121.
Audie Murphy Middle School
(Math: 36% | Reading: 50%)
Rank:
Rank:
5/
Bottom 50%10
53393 Sun Dance Dr
Fort Hood, TX 76544
(254) 336-6530
Fort Hood, TX 76544
(254) 336-6530
Grades: 6-8
| 795 students
Rank: #2222.
Haynes Elementary School
(Math: 30% | Reading: 53%)
Rank:
Rank:
5/
Bottom 50%10
3309 W Canadian River Loop
Killeen, TX 76549
(254) 336-6750
Killeen, TX 76549
(254) 336-6750
Grades: PK-5
| 768 students
Rank: #2323.
Mountain View Elementary School
(Math: 36% | Reading: 47%)
Rank:
Rank:
5/
Bottom 50%10
500 Mountain Lion Rd
Harker Heights, TX 76548
(254) 336-1900
Harker Heights, TX 76548
(254) 336-1900
Grades: PK-5
| 740 students
Rank: #2424.
Venable Village Elementary School
(Math: 35-39% | Reading: 46%)
Rank:
Rank:
5/
Bottom 50%10
60160 Venable Rd
Fort Hood, TX 76544
(254) 336-1980
Fort Hood, TX 76544
(254) 336-1980
Grades: PK-5
| 684 students
Rank: #2525.
Iduma Elementary School
(Math: 35% | Reading: 47%)
Rank:
Rank:
5/
Bottom 50%10
4400 Foster Ln
Killeen, TX 76549
(254) 336-2590
Killeen, TX 76549
(254) 336-2590
Grades: PK-5
| 808 students
Rank: #2626.
Clifton Park Elementary School
(Math: 34% | Reading: 47%)
Rank:
Rank:
5/
Bottom 50%10
1801 S 2nd St
Killeen, TX 76541
(254) 336-1580
Killeen, TX 76541
(254) 336-1580
Grades: PK-5
| 990 students
Rank: #2727.
Harker Heights High School
(Math: 30% | Reading: 49%)
Rank:
Rank:
4/
Bottom 50%10
1001 E Fm 2410
Harker Heights, TX 76548
(254) 336-0800
Harker Heights, TX 76548
(254) 336-0800
Grades: 9-12
| 2,268 students
Rank: #2828.
Charles E Patterson Middle School
(Math: 33% | Reading: 46%)
Rank:
Rank:
4/
Bottom 50%10
8383 W Trimmier Rd
Killeen, TX 76542
(254) 336-7100
Killeen, TX 76542
(254) 336-7100
Grades: 6-8
| 1,022 students
Rank: #2929.
Roy J Smith Middle School
(Math: 31% | Reading: 46%)
Rank:
Rank:
4/
Bottom 50%10
6000 Brushy Creek Dr
Killeen, TX 76549
(254) 336-1050
Killeen, TX 76549
(254) 336-1050
Grades: 6-8
| 1,280 students
Rank: #3030.
Brookhaven Elementary School
(Math: 32% | Reading: 43%)
Rank:
Rank:
4/
Bottom 50%10
3221 Hilliard Ave
Killeen, TX 76543
(254) 336-1440
Killeen, TX 76543
(254) 336-1440
Grades: PK-5
| 557 students
Rank: #3131.
Pat Carney Elementary School
(Math: 30% | Reading: 44%)
Rank:
Rank:
4/
Bottom 50%10
5501 Azura Way
Killeen, TX 76549
(254) 336-1940
Killeen, TX 76549
(254) 336-1940
Grades: PK-5
| 714 students
Rank: #3232.
Reeces Creek Elementary School
(Math: 30% | Reading: 43%)
Rank:
Rank:
3/
Bottom 50%10
400 W Stan Schlueter Loop
Killeen, TX 76542
(254) 336-2150
Killeen, TX 76542
(254) 336-2150
Grades: PK-5
| 868 students
Rank: #33 - 3433. - 34.
C E Ellison High School
(Math: 25% | Reading: 44%)
Rank:
Rank:
3/
Bottom 50%10
909 E Elms Rd
Killeen, TX 76542
(254) 336-0600
Killeen, TX 76542
(254) 336-0600
Grades: 9-12
| 1,687 students
Rank: #33 - 3433. - 34.
Timber Ridge Elementary School
(Math: 25% | Reading: 44%)
Rank:
Rank:
3/
Bottom 50%10
5402 White Rock Dr
Killeen, TX 76542
(254) 336-6630
Killeen, TX 76542
(254) 336-6630
Grades: PK-5
| 747 students
Rank: #3535.
Live Oak Ridge Middle School
(Math: 25% | Reading: 41%)
Rank:
Rank:
2/
Bottom 50%10
2600 Robinett Rd
Killeen, TX 76549
(254) 336-2490
Killeen, TX 76549
(254) 336-2490
Grades: 6-8
| 683 students
Show 23 more public schools in Killeen Independent School District (out of 58 total schools)
Loading...
Frequently Asked Questions
How many schools belong to Killeen Independent School District?
Killeen Independent School District manages 58 public schools serving 43,864 students.
What is the rank of Killeen Independent School District?
Killeen Independent School District is ranked #834 out of 1,196 school districts in Texas (bottom 50%) based off of combined math and reading proficiency testing data for the 2021-2022 school year. This district ranks in the top 20% of Texas school districts for: Most diverse schools (Top 1%) and Largest student body (number of students) (Top 1%)
What is the racial composition of students in Killeen Independent School District?
34% of Killeen Independent School District students are Hispanic, 34% of students are Black, 17% of students are White, 10% of students are Two or more races, 2% of students are Asian, 2% of students are Hawaiian, and 1% of students are American Indian.
What is the student/teacher ratio of Killeen Independent School District?
Killeen Independent School District has a student/teacher ratio of 16:1, which is higher than the Texas state average of 15:1.
What is Killeen Independent School District's spending/student ratio?
The school district's spending/student of $14,438 is higher than the state median of $14,116. The school district spending/student has stayed relatively flat over four school years.
Recent Articles

What Is A Charter School?
Explore the world of charter schools in this comprehensive guide. Learn about their history, how they operate, and the pros and cons of this educational innovation. Discover key facts about charter schools, including admission policies, demographics, and funding, as well as what to look for when considering a charter school for your child.

10 Reasons Why High School Sports Benefit Students
Discover the 10 compelling reasons why high school sports are beneficial for students. This comprehensive article explores how athletics enhance academic performance, foster personal growth, and develop crucial life skills. From improved fitness and time management to leadership development and community representation, learn why participating in high school sports can be a game-changer for students' overall success and well-being.

February 05, 2025
Understanding the U.S. Department of Education: Structure, Impact, and EvolutionWe explore how the Department of Education shapes American education, from its cabinet-level leadership to its impact on millions of students, written for general audiences seeking clarity on this vital institution.


