Top Rankings
Mulberry/Pleasant View Bi-County Schools School District ranks among the top 20% of public school district in Arkansas for:
Category
Attribute
Student Attention
Lowest student:teacher ratio (Top 1%)
For the 2025 school year, there are 3 public schools serving 385 students in Mulberry/Pleasant View Bi-County Schools School District. This district's average testing ranking is 3/10, which is in the bottom 50% of public schools in Arkansas.
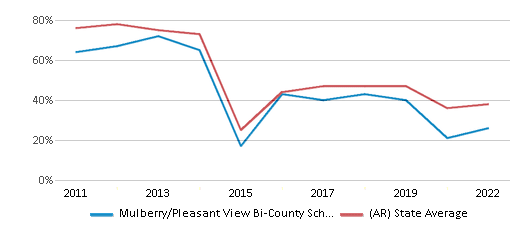
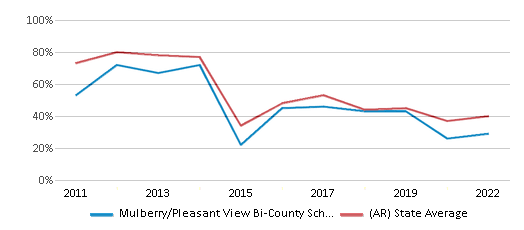
Public Schools in Mulberry/Pleasant View Bi-County Schools School District have an average math proficiency score of 26% (versus the Arkansas public school average of 39%), and reading proficiency score of 28% (versus the 40% statewide average).
Minority enrollment is 9% of the student body (majority Hispanic), which is less than the Arkansas public school average of 42% (majority Black).
Overview
This School District
This State (AR)
# Schools
3 Schools
1,110 Schools
# Students
385 Students
485,111 Students
# Teachers
49 Teachers
38,779 Teachers
Student : Teacher Ratio
8:1
8:1
District Rank
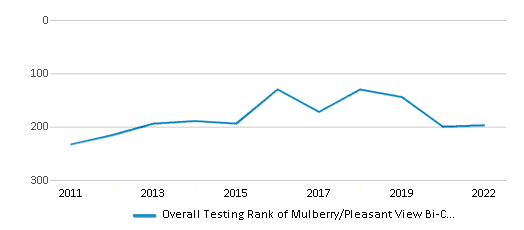
Mulberry/Pleasant View Bi-County Schools School District, which is ranked within the bottom 50% of all 258 school districts in Arkansas (based off of combined math and reading proficiency testing data) for the 2021-2022 school year.
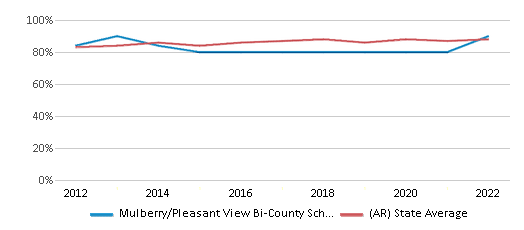
The school district's graduation rate of 90% has increased from 80% over five school years.
Overall District Rank
#197 out of 259 school districts
(Bottom 50%)
(Bottom 50%)
Math Test Scores (% Proficient)
26%
38%
Reading/Language Arts Test Scores (% Proficient)
29%
40%
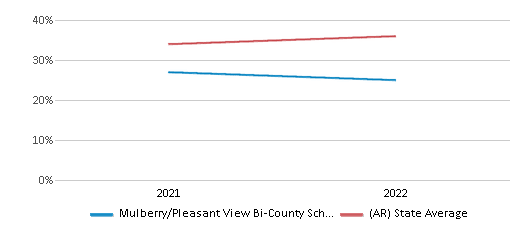
Science Test Scores (% Proficient)
25%
36%
Graduation Rate
≥90%
88%
Students by Ethnicity:
Diversity Score
0.18
0.61
# American Indian Students
7 Students
2,795 Students
% American Indian Students
2%
n/a
# Asian Students
n/a
8,854 Students
% Asian Students
n/a
2%
# Hispanic Students
11 Students
71,016 Students
% Hispanic Students
3%
15%
# Black Students
n/a
94,274 Students
% Black Students
n/a
19%
# White Students
349 Students
280,739 Students
% White Students
90%
58%
# Hawaiian Students
n/a
4,966 Students
% Hawaiian Students
n/a
1%
# Two or more races Students
18 Students
22,677 Students
% of Two or more races Students
5%
5%
Students by Grade:
# Students in PK Grade:
-
10,102
# Students in K Grade:
35
34,850
# Students in 1st Grade:
24
35,859
# Students in 2nd Grade:
27
37,037
# Students in 3rd Grade:
29
35,957
# Students in 4th Grade:
30
35,919
# Students in 5th Grade:
32
35,951
# Students in 6th Grade:
22
36,175
# Students in 7th Grade:
34
36,641
# Students in 8th Grade:
35
37,270
# Students in 9th Grade:
32
39,879
# Students in 10th Grade:
30
39,369
# Students in 11th Grade:
24
37,430
# Students in 12th Grade:
31
32,498
# Ungraded Students:
-
174
District Revenue and Spending
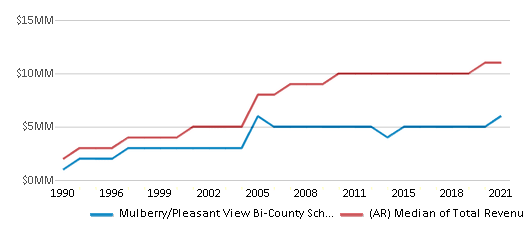
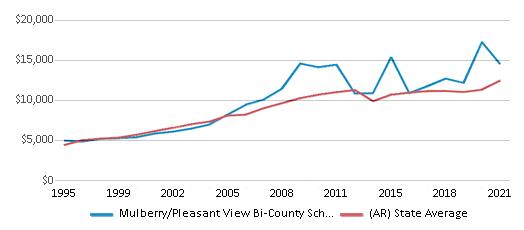
The revenue/student of $16,096 is higher than the state median of $13,132. The school district revenue/student has grown by 12% over four school years.
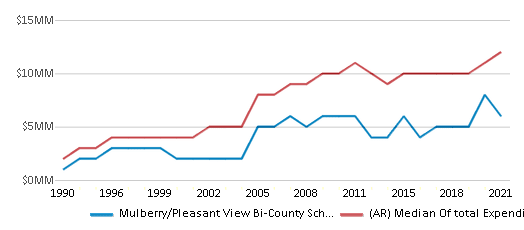
The school district's spending/student of $16,330 is higher than the state median of $13,043. The school district spending/student has grown by 12% over four school years.
Total Revenue
$6 MM
$6,371 MM
Spending
$6 MM
$6,327 MM
Revenue / Student
$16,096
$13,132
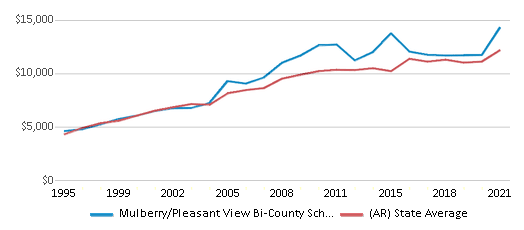
Spending / Student
$16,330
$13,043
Best Mulberry/Pleasant View Bi-County Schools School District Public Schools (2025)
School
(Math and Reading Proficiency)
(Math and Reading Proficiency)
Location
Grades
Students
Rank: #11.
Marvin Primary School
(Math: 30-39% | Reading: 30-39%)
Rank:
Rank:
4/
Bottom 50%10
1319 N Main St
Mulberry, AR 72947
(479) 997-1495
Mulberry, AR 72947
(479) 997-1495
Grades: K-4
| 145 students
Rank: #22.
Pleasant View Campus School
(Math: 25-29% | Reading: 25-29%)
Rank:
Rank:
3/
Bottom 50%10
5750 Hornet Ln
Ozark, AR 72949
(479) 997-8469
Ozark, AR 72949
(479) 997-8469
Grades: 5-8
| 123 students
Rank: #33.
Mulberry High School
(Math: 11-19% | Reading: 20-29%)
Rank:
Rank:
2/
Bottom 50%10
203 W 5th St
Mulberry, AR 72947
(479) 997-1363
Mulberry, AR 72947
(479) 997-1363
Grades: 9-12
| 117 students
Frequently Asked Questions
How many schools belong to Mulberry/Pleasant View Bi-County Schools School District?
Mulberry/Pleasant View Bi-County Schools School District manages 3 public schools serving 385 students.
What is the rank of Mulberry/Pleasant View Bi-County Schools School District?
Mulberry/Pleasant View Bi-County Schools School District is ranked #199 out of 258 school districts in Arkansas (bottom 50%) based off of combined math and reading proficiency testing data for the 2021-2022 school year. This district ranks in the top 20% of Arkansas school districts for: Lowest student:teacher ratio (Top 1%)
What is the racial composition of students in Mulberry/Pleasant View Bi-County Schools School District?
90% of Mulberry/Pleasant View Bi-County Schools School District students are White, 5% of students are Two or more races, 3% of students are Hispanic, and 2% of students are American Indian.
What is the student/teacher ratio of Mulberry/Pleasant View Bi-County Schools School District?
Mulberry/Pleasant View Bi-County Schools School District has a student/teacher ratio of 8:1, which is lower than the Arkansas state average of 13:1.
What is Mulberry/Pleasant View Bi-County Schools School District's spending/student ratio?
The school district's spending/student of $16,330 is higher than the state median of $13,043. The school district spending/student has grown by 12% over four school years.
Recent Articles

What Is A Charter School?
Explore the world of charter schools in this comprehensive guide. Learn about their history, how they operate, and the pros and cons of this educational innovation. Discover key facts about charter schools, including admission policies, demographics, and funding, as well as what to look for when considering a charter school for your child.

10 Reasons Why High School Sports Benefit Students
Discover the 10 compelling reasons why high school sports are beneficial for students. This comprehensive article explores how athletics enhance academic performance, foster personal growth, and develop crucial life skills. From improved fitness and time management to leadership development and community representation, learn why participating in high school sports can be a game-changer for students' overall success and well-being.

February 05, 2025
Understanding the U.S. Department of Education: Structure, Impact, and EvolutionWe explore how the Department of Education shapes American education, from its cabinet-level leadership to its impact on millions of students, written for general audiences seeking clarity on this vital institution.


