Top Rankings
Pulaski County Special School District ranks among the top 20% of public school district in Arkansas for:
Category
Attribute
Diversity
Most diverse schools (Top 1%)
Community Size
Largest student body (number of students) (Top 1%)
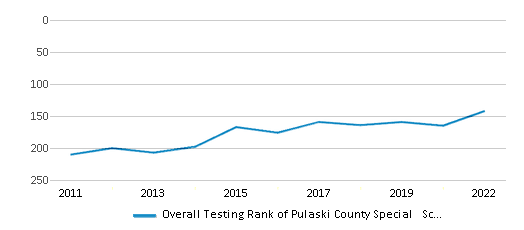
For the 2025 school year, there are 26 public schools serving 12,290 students in Pulaski County Special School District. This district's average testing ranking is 5/10, which is in the bottom 50% of public schools in Arkansas.
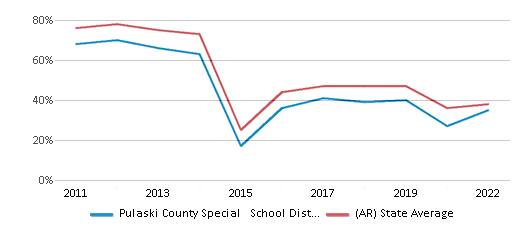
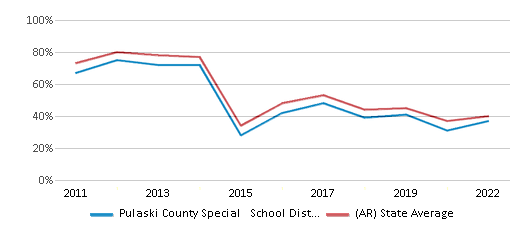
Public Schools in Pulaski County Special School District have an average math proficiency score of 35% (versus the Arkansas public school average of 39%), and reading proficiency score of 36% (versus the 40% statewide average).
Minority enrollment is 66% of the student body (majority Black), which is more than the Arkansas public school average of 42% (majority Black).
Overview
This School District
This State (AR)
# Schools
26 Schools
1,110 Schools
# Students
12,290 Students
485,111 Students
# Teachers
934 Teachers
38,779 Teachers
Student : Teacher Ratio
13:1
13:1
District Rank
Pulaski County Special School District, which is ranked within the bottom 50% of all 258 school districts in Arkansas (based off of combined math and reading proficiency testing data) for the 2021-2022 school year.
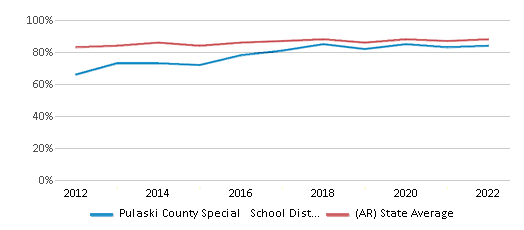
The school district's graduation rate of 84% has increased from 81% over five school years.
Overall District Rank
#142 out of 259 school districts
(Bottom 50%)
(Bottom 50%)
Math Test Scores (% Proficient)
35%
38%
Reading/Language Arts Test Scores (% Proficient)
37%
40%
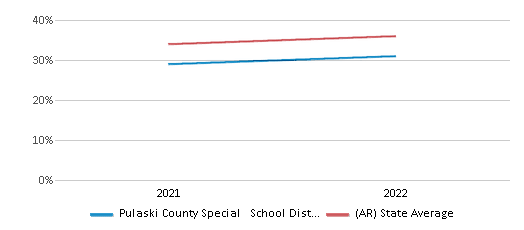
Science Test Scores (% Proficient)
31%
36%
Graduation Rate
84%
88%
Students by Ethnicity:
Diversity Score
0.66
0.61
# American Indian Students
43 Students
2,795 Students
% American Indian Students
n/a
n/a
# Asian Students
318 Students
8,854 Students
% Asian Students
3%
2%
# Hispanic Students
1,422 Students
71,016 Students
% Hispanic Students
11%
15%
# Black Students
5,655 Students
94,274 Students
% Black Students
46%
19%
# White Students
4,137 Students
280,739 Students
% White Students
34%
58%
# Hawaiian Students
11 Students
4,966 Students
% Hawaiian Students
n/a
1%
# Two or more races Students
704 Students
22,677 Students
% of Two or more races Students
6%
5%
Students by Grade:
# Students in PK Grade:
454
10,102
# Students in K Grade:
830
34,850
# Students in 1st Grade:
895
35,859
# Students in 2nd Grade:
848
37,037
# Students in 3rd Grade:
853
35,957
# Students in 4th Grade:
855
35,919
# Students in 5th Grade:
866
35,951
# Students in 6th Grade:
949
36,175
# Students in 7th Grade:
936
36,641
# Students in 8th Grade:
883
37,270
# Students in 9th Grade:
1,178
39,879
# Students in 10th Grade:
1,026
39,369
# Students in 11th Grade:
916
37,430
# Students in 12th Grade:
800
32,498
# Ungraded Students:
1
174
District Revenue and Spending
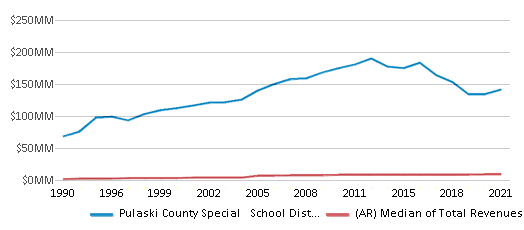
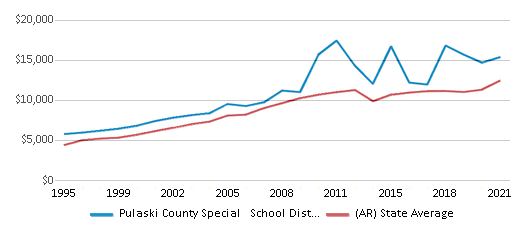
The revenue/student of $13,821 is higher than the state median of $13,132. The school district revenue/student has stayed relatively flat over four school years.
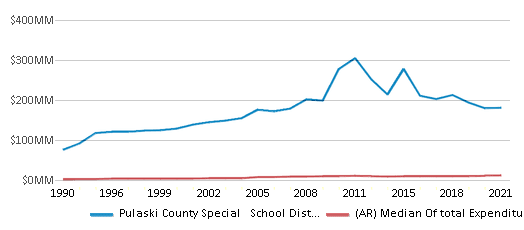
The school district's spending/student of $14,697 is higher than the state median of $13,043. The school district spending/student has stayed relatively flat over four school years.
Total Revenue
$170 MM
$6,371 MM
Spending
$181 MM
$6,327 MM
Revenue / Student
$13,821
$13,132
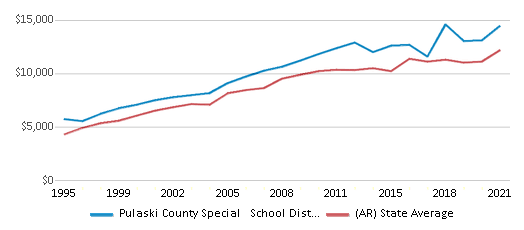
Spending / Student
$14,697
$13,043
Best Pulaski County Special School District Public Schools (2025)
School
(Math and Reading Proficiency)
(Math and Reading Proficiency)
Location
Grades
Students
Rank: #11.
Baker Elementary School
(Math: 80-84% | Reading: 80-84%)
Rank:
Rank:
10/
Top 1%10
15001 Kanis Rd
Little Rock, AR 72223
(501) 228-3250
Little Rock, AR 72223
(501) 228-3250
Grades: PK-5
| 392 students
Rank: #22.
Chenal Elementary School
(Math: 70% | Reading: 65%)
Rank:
Rank:
10/
Top 5%10
21201 Denny Rd
Little Rock, AR 72223
(501) 490-2000
Little Rock, AR 72223
(501) 490-2000
Grades: K-5
| 420 students
Rank: #33.
Sylvan Hills Elementary School
(Math: 55-59% | Reading: 50-54%)
Rank:
Rank:
9/
Top 20%10
402 Dee Jay Hudson Dr
Sherwood, AR 72120
(501) 833-1140
Sherwood, AR 72120
(501) 833-1140
Grades: PK-5
| 483 students
Rank: #44.
Sherwood Elementary School
(Math: 60-64% | Reading: 45-49%)
Rank:
Rank:
9/
Top 20%10
307 Verona Ave
Sherwood, AR 72120
(501) 833-1150
Sherwood, AR 72120
(501) 833-1150
Grades: PK-5
| 405 students
Rank: #55.
Joe T. Robinson Middle School
(Math: 45% | Reading: 55%)
Rank:
Rank:
9/
Top 20%10
21001 Hwy 10
Little Rock, AR 72223
(501) 868-2410
Little Rock, AR 72223
(501) 868-2410
Grades: 6-8
| 543 students
Rank: #66.
Joe T. Robinson Elem. School
(Math: 50-54% | Reading: 45-49%)
Rank:
Rank:
9/
Top 20%10
21600 Hwy 10
Little Rock, AR 72223
(501) 868-2420
Little Rock, AR 72223
(501) 868-2420
Grades: PK-5
| 305 students
Rank: #77.
Cato Elementary School
(Math: 55-59% | Reading: 40-44%)
Rank:
Rank:
8/
Top 30%10
9906 Cato Rd
Sherwood, AR 72120
(501) 833-1160
Sherwood, AR 72120
(501) 833-1160
Grades: PK-5
| 323 students
Rank: #88.
Oakbrooke Elementary School
(Math: 45-49% | Reading: 40-44%)
Rank:
Rank:
7/
Top 50%10
2200 Thornhill
Sherwood, AR 72120
(501) 833-1190
Sherwood, AR 72120
(501) 833-1190
Grades: PK-5
| 406 students
Rank: #99.
Pine Forest Elementary School
(Math: 50-54% | Reading: 35-39%)
Rank:
Rank:
7/
Top 50%10
400 Pine Forest Dr
Maumelle, AR 72113
(501) 851-5380
Maumelle, AR 72113
(501) 851-5380
Grades: K-5
| 323 students
Rank: #1010.
Sylvan Hills Middle School
(Math: 37% | Reading: 38%)
Rank:
Rank:
5/
Bottom 50%10
401 Dee Jay Hudson Dr
Sherwood, AR 72120
(501) 833-1120
Sherwood, AR 72120
(501) 833-1120
Grades: 6-7
| 826 students
Rank: #1111.
Maumelle Middle School
(Math: 35% | Reading: 41%)
Rank:
Rank:
5/
Bottom 50%10
1000 Carnaham Dr
Maumelle, AR 72113
(501) 851-8990
Maumelle, AR 72113
(501) 851-8990
Grades: 6-8
| 508 students
Rank: #12 - 1312. - 13.
Joe T. Robinson High School
(Math: 29% | Reading: 37%)
Rank:
Rank:
5/
Bottom 50%10
21501 Hwy 10
Little Rock, AR 72223
(501) 868-2400
Little Rock, AR 72223
(501) 868-2400
Grades: 9-12
| 845 students
Rank: #12 - 1312. - 13.
Sylvan Hills Junior High School
(Math: 29% | Reading: 37%)
Rank:
Rank:
5/
Bottom 50%10
10020 Bamboo Lane
Sherwood, AR 72120
(501) 833-1170
Sherwood, AR 72120
(501) 833-1170
Grades: 8-9
| 743 students
Rank: #1414.
Lawson Elementary School
(Math: 40-44% | Reading: 20-24%)
Rank:
Rank:
4/
Bottom 50%10
19901 Lawson Rd
Little Rock, AR 72210
(501) 821-7000
Little Rock, AR 72210
(501) 821-7000
Grades: K-5
| 183 students
Rank: #1515.
Daisy Bates Elementary School
(Math: 35-39% | Reading: 25-29%)
Rank:
Rank:
4/
Bottom 50%10
14300 Dineen Dr
Little Rock, AR 72206
(501) 897-2171
Little Rock, AR 72206
(501) 897-2171
Grades: PK-5
| 418 students
Rank: #1616.
Sylvan Hills High School
(Math: 27% | Reading: 31%)
Rank:
Rank:
3/
Bottom 50%10
484 Bear Paw Rd
Sherwood, AR 72120
(501) 833-1100
Sherwood, AR 72120
(501) 833-1100
Grades: 10-12
| 1,061 students
Rank: #1717.
Oak Grove Elementary School
(Math: 30-39% | Reading: 20-29%)
Rank:
Rank:
3/
Bottom 50%10
5703 Oak Grove Rd
North Little Rock, AR 72118
(501) 851-5370
North Little Rock, AR 72118
(501) 851-5370
Grades: PK-5
| 202 students
Rank: #1818.
Crystal Hill Elementary School
(Math: 25% | Reading: 27%)
Rank:
Rank:
3/
Bottom 50%10
5001 N Shore Dr
North Little Rock, AR 72118
(501) 791-8000
North Little Rock, AR 72118
(501) 791-8000
Grades: PK-5
| 470 students
Rank: #1919.
Landmark Elementary School
(Math: 25-29% | Reading: 20-24%)
Rank:
Rank:
3/
Bottom 50%10
16712 Arch St Pike
Little Rock, AR 72206
(501) 888-8790
Little Rock, AR 72206
(501) 888-8790
Grades: PK-5
| 296 students
Rank: #2020.
Maumelle High School
(Math: 20% | Reading: 28%)
Rank:
Rank:
2/
Bottom 50%10
100 Victory Ln
Maumelle, AR 72113
(501) 851-5350
Maumelle, AR 72113
(501) 851-5350
Grades: 9-12
| 844 students
Rank: #2121.
William Jefferson Clinton Elementary School
(Math: 27% | Reading: 16%)
Rank:
Rank:
2/
Bottom 50%10
142 Hollywood Blvd
Sherwood, AR 72120
(501) 833-1200
Sherwood, AR 72120
(501) 833-1200
Grades: PK-5
| 565 students
Rank: #2222.
Mills Middle School
(Math: 23% | Reading: 21%)
Rank:
Rank:
2/
Bottom 50%10
808 E Dixon Rd
Little Rock, AR 72206
(501) 490-5730
Little Rock, AR 72206
(501) 490-5730
Grades: 6-8
| 494 students
Rank: #2323.
Driven Virtual Academy
Charter School
(Math: 15% | Reading: 27%)
Rank:
Rank:
2/
Bottom 50%10
21001 Cantrell Road
Little Rock, AR 72223
(501) 234-3703
Little Rock, AR 72223
(501) 234-3703
Grades: K-12
| 218 students
Rank: #2424.
College Station Elem. School
(Math: 11-19% | Reading: 11-19%)
Rank:
Rank:
1/
Bottom 50%10
4710 Frazier Pike Rd
College Station, AR 72053
(501) 490-5750
College Station, AR 72053
(501) 490-5750
Grades: PK-5
| 136 students
Rank: #2525.
Mills University Studies High School
(Math: 10% | Reading: 15%)
Rank:
Rank:
1/
Bottom 50%10
1205 E Dixon Rd
Little Rock, AR 72206
(501) 490-5700
Little Rock, AR 72206
(501) 490-5700
Grades: 8-12
| 671 students
Rank: #2626.
Harris Elementary School
(Math: 10-14% | Reading: 6-9%)
Rank:
Rank:
1/
Bottom 50%10
4424 Hwy 161 N
North Little Rock, AR 72117
(501) 955-3550
North Little Rock, AR 72117
(501) 955-3550
Grades: PK-5
| 210 students
Frequently Asked Questions
How many schools belong to Pulaski County Special School District?
Pulaski County Special School District manages 26 public schools serving 12,290 students.
What is the rank of Pulaski County Special School District?
Pulaski County Special School District is ranked #145 out of 258 school districts in Arkansas (bottom 50%) based off of combined math and reading proficiency testing data for the 2021-2022 school year. This district ranks in the top 20% of Arkansas school districts for: Most diverse schools (Top 1%) and Largest student body (number of students) (Top 1%)
What is the racial composition of students in Pulaski County Special School District?
46% of Pulaski County Special School District students are Black, 34% of students are White, 11% of students are Hispanic, 6% of students are Two or more races, and 3% of students are Asian.
What is the student/teacher ratio of Pulaski County Special School District?
Pulaski County Special School District has a student/teacher ratio of 13:1, which is equal to the Arkansas state average of 13:1.
What is Pulaski County Special School District's spending/student ratio?
The school district's spending/student of $14,697 is higher than the state median of $13,043. The school district spending/student has stayed relatively flat over four school years.
Recent Articles

What Is A Charter School?
Explore the world of charter schools in this comprehensive guide. Learn about their history, how they operate, and the pros and cons of this educational innovation. Discover key facts about charter schools, including admission policies, demographics, and funding, as well as what to look for when considering a charter school for your child.

10 Reasons Why High School Sports Benefit Students
Discover the 10 compelling reasons why high school sports are beneficial for students. This comprehensive article explores how athletics enhance academic performance, foster personal growth, and develop crucial life skills. From improved fitness and time management to leadership development and community representation, learn why participating in high school sports can be a game-changer for students' overall success and well-being.

February 05, 2025
Understanding the U.S. Department of Education: Structure, Impact, and EvolutionWe explore how the Department of Education shapes American education, from its cabinet-level leadership to its impact on millions of students, written for general audiences seeking clarity on this vital institution.


