School Overview
School Type
Grades Offered
n/a
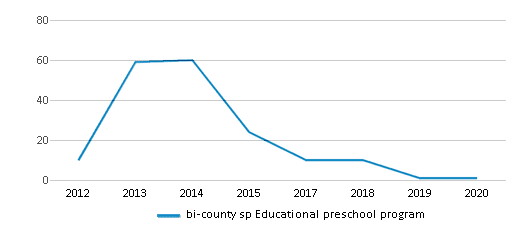
Total Students (19-20)
1 student
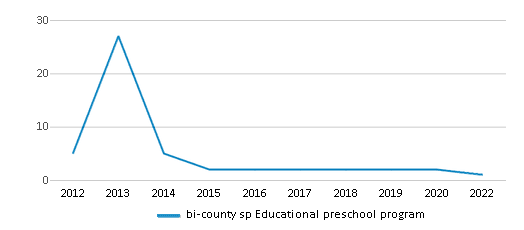
Total Classroom Teachers
1 teacher
School Rankings
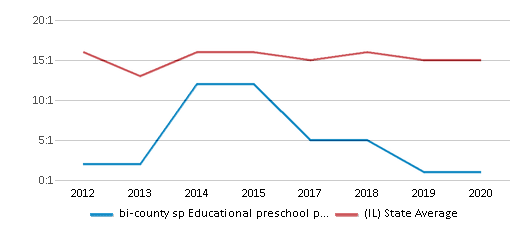
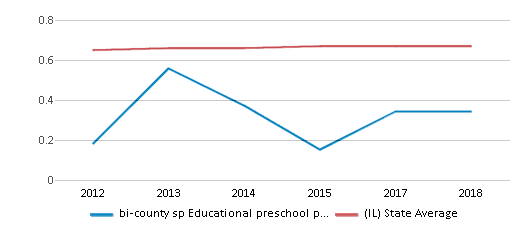
Student : Teacher Ratio
n/a
13:1
American Indian
(19-20)n/a
n/a
Asian
(19-20)n/a
5%
Hispanic
(19-20)n/a
26%
Black
(19-20)n/a
17%
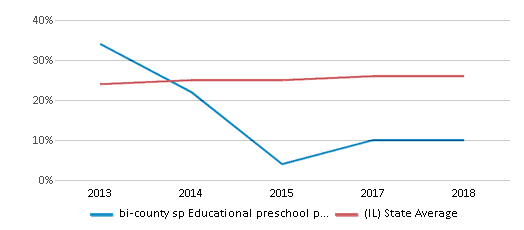
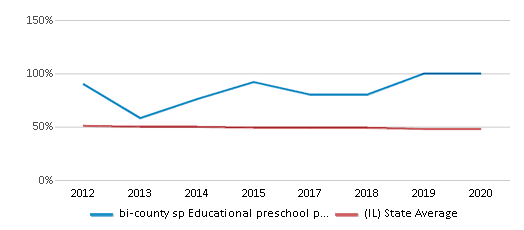
White
(19-20)100%
48%
Hawaiian
(19-20)n/a
n/a
Two or more races
(19-20)n/a
4%
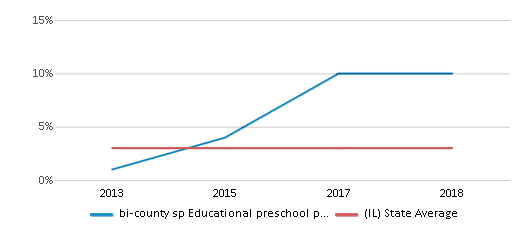
Eligible for Free Lunch (19-20)
100%
47%
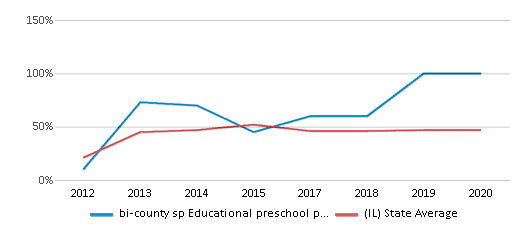
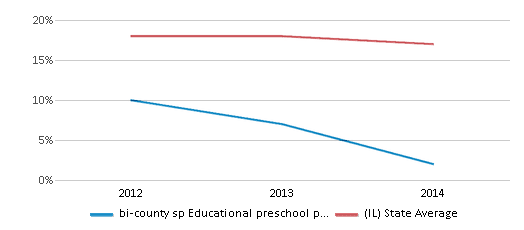
Eligible for Reduced Lunch (11-12)
20%
27%
School Statewide Testing
School District Name
Source: National Center for Education Statistics (NCES), IL Dept. of Education
Frequently Asked Questions
How many students attend bi-county sp Educational preschool program?
1 students attend bi-county sp Educational preschool program.
What is the racial composition of the student body?
100% of bi-county sp Educational preschool program students are White.
What school district is bi-county sp Educational preschool program part of?
bi-county sp Educational preschool program is part of Bi-County Special Educ Coop School District.
Recent Articles

Sexual Harassment at Age 6: The Tale of a First Grade Suspension
A six-year old in Aurora, Colorado, was suspended after singing an LMFAO song to a little girl in his class and reportedly “shaking his booty.” We look at the case and the sexual harassment problem in public schools today.

How Scaffolding Could Change the Way Your Child Learns
This article explores the concept of instructional scaffolding, a teaching method that enhances learning by breaking down complex tasks into manageable parts. It highlights how scaffolding supports students in developing critical thinking skills and becoming more independent learners. The article discusses the benefits of scaffolding, including improved engagement and reduced anxiety, and provides strategies for its implementation across various educational levels.

February 05, 2025
Understanding the U.S. Department of Education: Structure, Impact, and EvolutionWe explore how the Department of Education shapes American education, from its cabinet-level leadership to its impact on millions of students, written for general audiences seeking clarity on this vital institution.


