Top Rankings
Glendale Unified School District ranks among the top 20% of public school district in California for:
Category
Attribute
Overall Rank
Highest overall rank (Top 20%)
Math Proficiency
Highest math proficiency (Top 20%)
Reading/Language Arts Proficiency
Highest reading/language arts proficiency (Top 20%)
Community Size
Largest student body (number of students) (Top 1%)
For the 2025 school year, there are 25 public elementary schools serving 16,441 students in Glendale Unified School District. This district's average elementary testing ranking is 9/10, which is in the top 20% of public elementary schools in California.
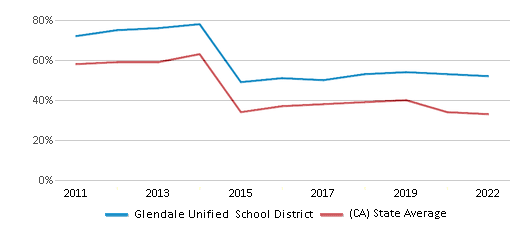
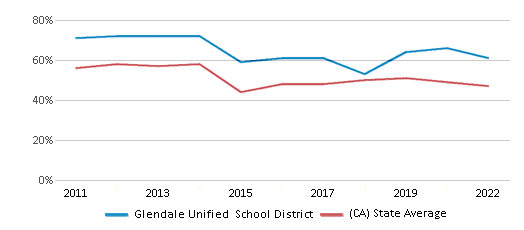
Public Elementary Schools in Glendale Unified School District have an average math proficiency score of 52% (versus the California public elementary school average of 35%), and reading proficiency score of 59% (versus the 45% statewide average).
Minority enrollment is 37% of the student body (majority Hispanic), which is less than the California public elementary school average of 79% (majority Hispanic).
Overview
This School District
This State (CA)
# Schools
34 Schools
7,700 Schools
# Students
25,007 Students
3,822,920 Students
# Teachers
1,089 Teachers
174,000 Teachers
Student : Teacher Ratio
23:1
23:1
District Rank
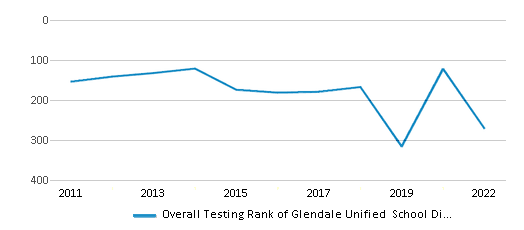
Glendale Unified School District, which is ranked #273 of all 1,925 school districts in California (based off of combined math and reading proficiency testing data) for the 2021-2022 school year.
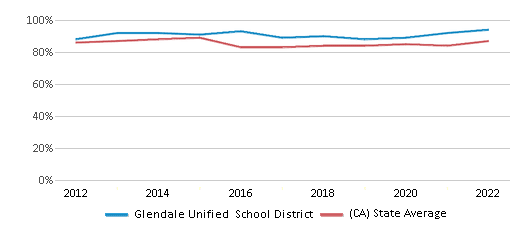
The school district's graduation rate of 94% has increased from 89% over five school years.
Overall District Rank
#271 out of 1941 school districts
(Top 20%)
(Top 20%)
Math Test Scores (% Proficient)
52%
33%
Reading/Language Arts Test Scores (% Proficient)
61%
47%
Science Test Scores (% Proficient)
40%
29%
Graduation Rate
94%
87%
Students by Ethnicity:
Diversity Score
0.57
0.64
# American Indian Students
26 Students
16,785 Students
% American Indian Students
n/a
1%
# Asian Students
3,544 Students
454,357 Students
% Asian Students
14%
12%
# Hispanic Students
4,743 Students
2,114,366 Students
% Hispanic Students
19%
55%
# Black Students
246 Students
189,461 Students
% Black Students
1%
5%
# White Students
15,476 Students
787,389 Students
% White Students
62%
21%
# Hawaiian Students
19 Students
15,077 Students
% Hawaiian Students
n/a
n/a
# Two or more races Students
942 Students
240,557 Students
% of Two or more races Students
4%
6%
Students by Grade:
# Students in PK Grade:
-
83
# Students in K Grade:
2,131
519,574
# Students in 1st Grade:
1,780
396,601
# Students in 2nd Grade:
1,950
414,466
# Students in 3rd Grade:
1,904
416,628
# Students in 4th Grade:
1,933
426,360
# Students in 5th Grade:
1,982
430,582
# Students in 6th Grade:
2,015
432,936
# Students in 7th Grade:
1,900
312,207
# Students in 8th Grade:
1,900
312,649
# Students in 9th Grade:
1,907
44,929
# Students in 10th Grade:
1,794
37,487
# Students in 11th Grade:
1,910
37,249
# Students in 12th Grade:
1,901
41,169
# Ungraded Students:
-
-
District Revenue and Spending
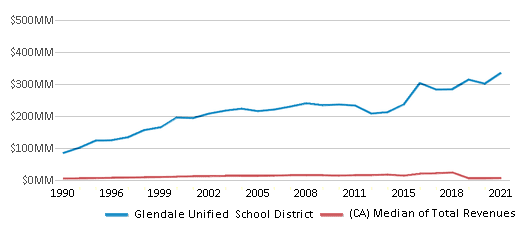
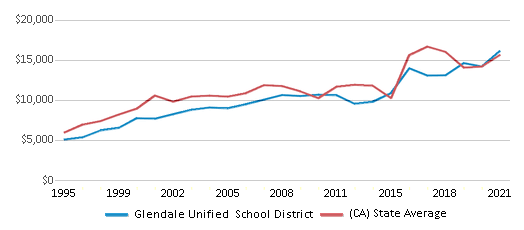
The revenue/student of $16,066 in this school district is less than the state median of $19,974. The school district revenue/student has stayed relatively flat over four school years.
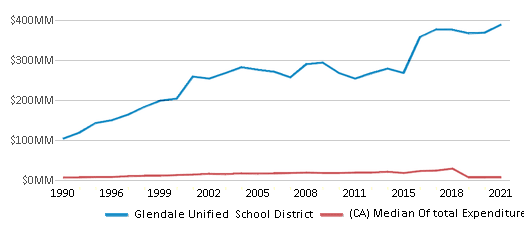
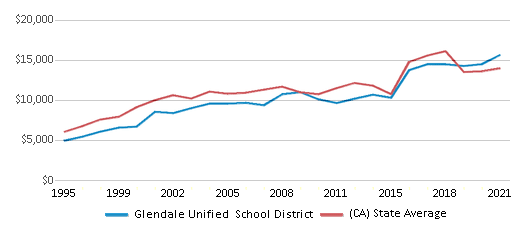
The school district's spending/student of $15,566 is less than the state median of $18,396. The school district spending/student has stayed relatively flat over four school years.
Total Revenue
$402 MM
$116,387 MM
Spending
$389 MM
$107,188 MM
Revenue / Student
$16,066
$19,974
Spending / Student
$15,566
$18,396
Best Glendale Unified School District Public Elementary Schools (2025)
School
(Math and Reading Proficiency)
(Math and Reading Proficiency)
Location
Grades
Students
Rank: #11.
Monte Vista Elementary School
(Math: 87% | Reading: 87%)
Rank:
Rank:
10/
Top 1%10
2620 Orange Ave.
La Crescenta, CA 91214
(818) 248-2617
La Crescenta, CA 91214
(818) 248-2617
Grades: K-6
| 696 students
Rank: #22.
Valley View Elementary School
(Math: 82% | Reading: 84%)
Rank:
Rank:
10/
Top 5%10
4900 Maryland Ave.
La Crescenta, CA 91214
(818) 236-3771
La Crescenta, CA 91214
(818) 236-3771
Grades: K-6
| 455 students
Rank: #33.
Mountain Avenue Elementary School
(Math: 75% | Reading: 82%)
Rank:
Rank:
10/
Top 5%10
2307 Mountain Ave.
La Crescenta, CA 91214
(818) 248-7766
La Crescenta, CA 91214
(818) 248-7766
Grades: K-6
| 570 students
Rank: #44.
Dunsmore Elementary School
(Math: 74% | Reading: 74%)
Rank:
Rank:
10/
Top 10%10
4717 Dunsmore Ave.
La Crescenta, CA 91214
(818) 248-1758
La Crescenta, CA 91214
(818) 248-1758
Grades: K-6
| 570 students
Rank: #55.
Abraham Lincoln Elementary School
(Math: 64% | Reading: 73%)
Rank:
Rank:
10/
Top 10%10
4310 New York Ave.
La Crescenta, CA 91214
(818) 249-1863
La Crescenta, CA 91214
(818) 249-1863
Grades: K-6
| 508 students
Rank: #66.
Horace Mann Elementary School
(Math: 63% | Reading: 71%)
Rank:
Rank:
9/
Top 20%10
501 East Acacia Ave.
Glendale, CA 91205
(818) 246-2421
Glendale, CA 91205
(818) 246-2421
Grades: K-5
| 646 students
Rank: #77.
Benjamin Franklin Elementary School
(Math: 60% | Reading: 72%)
Rank:
Rank:
9/
Top 20%10
1610 Lake St.
Glendale, CA 91201
(818) 243-1809
Glendale, CA 91201
(818) 243-1809
Grades: K-6
| 626 students
Rank: #88.
John C. Fremont Elementary School
(Math: 61% | Reading: 71%)
Rank:
Rank:
9/
Top 20%10
3320 Las Palmas Ave.
Glendale, CA 91208
(818) 249-3241
Glendale, CA 91208
(818) 249-3241
Grades: K-6
| 583 students
Rank: #99.
Mark Keppel Elementary School
(Math: 63% | Reading: 67%)
Rank:
Rank:
9/
Top 20%10
730 Glenwood Rd.
Glendale, CA 91202
(818) 244-2113
Glendale, CA 91202
(818) 244-2113
Grades: K-5
| 959 students
Rank: #1010.
Verdugo Woodlands Elementary School
(Math: 60% | Reading: 68%)
Rank:
Rank:
9/
Top 20%10
1751 North Verdugo Rd.
Glendale, CA 91208
(818) 241-2433
Glendale, CA 91208
(818) 241-2433
Grades: K-6
| 641 students
Rank: #1111.
Thomas Edison Elementary School
(Math: 57% | Reading: 64%)
Rank:
Rank:
9/
Top 20%10
435 South Pacific Ave.
Glendale, CA 91204
(818) 241-1807
Glendale, CA 91204
(818) 241-1807
Grades: K-6
| 862 students
Rank: #1212.
La Crescenta Elementary School
(Math: 58% | Reading: 61%)
Rank:
Rank:
9/
Top 20%10
4343 La Crescenta Ave.
La Crescenta, CA 91214
(818) 249-3187
La Crescenta, CA 91214
(818) 249-3187
Grades: K-6
| 416 students
Rank: #1313.
Glenoaks Elementary School
(Math: 54% | Reading: 56%)
Rank:
Rank:
8/
Top 30%10
2015 East Glenoaks Blvd.
Glendale, CA 91206
(818) 242-3747
Glendale, CA 91206
(818) 242-3747
Grades: K-6
| 509 students
Rank: #1414.
Balboa Elementary School
(Math: 53% | Reading: 56%)
Rank:
Rank:
8/
Top 30%10
1844 Bel Aire Dr.
Glendale, CA 91201
(818) 241-1801
Glendale, CA 91201
(818) 241-1801
Grades: K-6
| 806 students
Rank: #1515.
R. D. White Elementary School
(Math: 55% | Reading: 54%)
Rank:
Rank:
8/
Top 30%10
744 East Doran St.
Glendale, CA 91206
(818) 241-2164
Glendale, CA 91206
(818) 241-2164
Grades: K-5
| 967 students
Rank: #1616.
Thomas Jefferson Elementary School
(Math: 52% | Reading: 55%)
Rank:
Rank:
8/
Top 30%10
1540 Fifth St.
Glendale, CA 91201
(818) 243-4279
Glendale, CA 91201
(818) 243-4279
Grades: K-6
| 796 students
Rank: #1717.
Cerritos Elementary School
(Math: 42% | Reading: 56%)
Rank:
Rank:
8/
Top 30%10
120 East Cerritos Ave.
Glendale, CA 91205
(818) 244-7207
Glendale, CA 91205
(818) 244-7207
Grades: K-6
| 479 students
Rank: #1818.
College View
Special Education School
(Math: <50% | Reading: <50%)
Rank:
Rank:
8/
Top 30%10
1700 East Mountain St.
Glendale, CA 91207
(818) 246-8363
Glendale, CA 91207
(818) 246-8363
Grades: K-12
| 125 students
Rank: #1919.
John Muir Elementary School
(Math: 43% | Reading: 51%)
Rank:
Rank:
7/
Top 50%10
912 South Chevy Chase Dr.
Glendale, CA 91205
(818) 241-4848
Glendale, CA 91205
(818) 241-4848
Grades: K-6
| 818 students
Rank: #2020.
Verdugo Academy
Alternative School
(Math: 38% | Reading: 53%)
Rank:
Rank:
7/
Top 50%10
1700 East Mountain St.
Glendale, CA 91206
(818) 548-0740
Glendale, CA 91206
(818) 548-0740
Grades: K-12
| 173 students
Rank: #2121.
Eleanor J. Toll Middle School
(Math: 37% | Reading: 51%)
Rank:
Rank:
7/
Top 50%10
700 Glenwood Rd.
Glendale, CA 91202
(818) 244-8414
Glendale, CA 91202
(818) 244-8414
Grades: 6-8
| 1,349 students
Rank: #2222.
Theodore Roosevelt Middle School
(Math: 34% | Reading: 50%)
Rank:
Rank:
7/
Top 50%10
222 East Acacia Ave.
Glendale, CA 91206
(818) 242-6845
Glendale, CA 91206
(818) 242-6845
Grades: 6-8
| 818 students
Rank: #2323.
John Marshall Elementary School
(Math: 34% | Reading: 43%)
Rank:
Rank:
6/
Top 50%10
1201 East Broadway
Glendale, CA 91205
(818) 242-6834
Glendale, CA 91205
(818) 242-6834
Grades: K-5
| 450 students
Rank: #2424.
Columbus Elementary School
(Math: 36% | Reading: 40%)
Rank:
Rank:
6/
Top 50%10
425 West Milford St.
Glendale, CA 91203
(818) 242-7722
Glendale, CA 91203
(818) 242-7722
Grades: K-5
| 492 students
Rank: #2525.
Woodrow Wilson Middle School
(Math: 34% | Reading: 41%)
Rank:
Rank:
6/
Top 50%10
1221 Monterey Rd.
Glendale, CA 91206
(818) 244-8145
Glendale, CA 91206
(818) 244-8145
Grades: 6-8
| 1,127 students
Recent Articles

Sexual Harassment at Age 6: The Tale of a First Grade Suspension
A six-year old in Aurora, Colorado, was suspended after singing an LMFAO song to a little girl in his class and reportedly “shaking his booty.” We look at the case and the sexual harassment problem in public schools today.

How Scaffolding Could Change the Way Your Child Learns
This article explores the concept of instructional scaffolding, a teaching method that enhances learning by breaking down complex tasks into manageable parts. It highlights how scaffolding supports students in developing critical thinking skills and becoming more independent learners. The article discusses the benefits of scaffolding, including improved engagement and reduced anxiety, and provides strategies for its implementation across various educational levels.

February 05, 2025
Understanding the U.S. Department of Education: Structure, Impact, and EvolutionWe explore how the Department of Education shapes American education, from its cabinet-level leadership to its impact on millions of students, written for general audiences seeking clarity on this vital institution.


