Top Rankings
Lucia Mar Unified School District ranks among the top 20% of public school district in California for:
Category
Attribute
Community Size
Largest student body (number of students) (Top 1%)
For the 2025 school year, there are 12 public elementary schools serving 4,886 students in Lucia Mar Unified School District. This district's average elementary testing ranking is 7/10, which is in the top 50% of public elementary schools in California.
Public Elementary Schools in Lucia Mar Unified School District have an average math proficiency score of 36% (versus the California public elementary school average of 35%), and reading proficiency score of 47% (versus the 45% statewide average).
Minority enrollment is 61% of the student body (majority Hispanic), which is less than the California public elementary school average of 79% (majority Hispanic).
Overview
This School District
This State (CA)
# Schools
19 Schools
7,700 Schools
# Students
9,619 Students
3,822,920 Students
# Teachers
492 Teachers
174,000 Teachers
Student : Teacher Ratio
20:1
20:1
District Rank
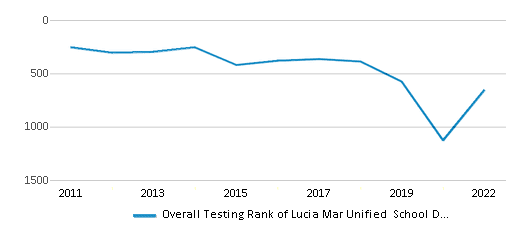
Lucia Mar Unified School District, which is ranked #685 of all 1,925 school districts in California (based off of combined math and reading proficiency testing data) for the 2021-2022 school year.
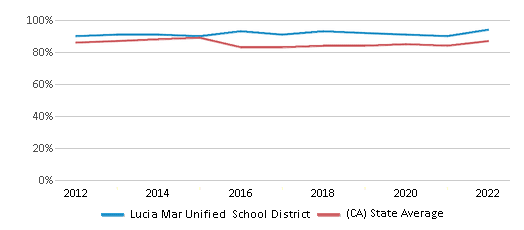
The school district's graduation rate of 94% has increased from 91% over five school years.
Overall District Rank
#656 out of 1941 school districts
(Top 50%)
(Top 50%)
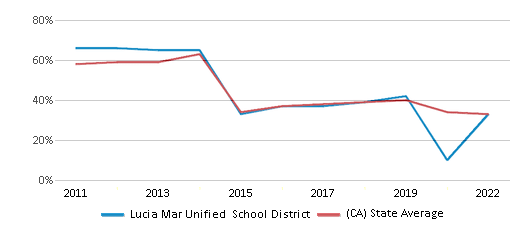
Math Test Scores (% Proficient)
33%
33%
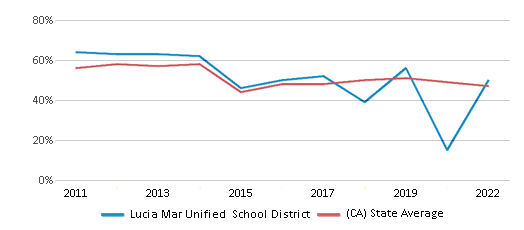
Reading/Language Arts Test Scores (% Proficient)
50%
47%
Science Test Scores (% Proficient)
31%
29%
Graduation Rate
94%
87%
Students by Ethnicity:
Diversity Score
0.59
0.64
# American Indian Students
22 Students
16,785 Students
% American Indian Students
n/a
1%
# Asian Students
200 Students
454,357 Students
% Asian Students
2%
12%
# Hispanic Students
4,802 Students
2,114,366 Students
% Hispanic Students
50%
55%
# Black Students
40 Students
189,461 Students
% Black Students
1%
5%
# White Students
3,926 Students
787,389 Students
% White Students
41%
21%
# Hawaiian Students
11 Students
15,077 Students
% Hawaiian Students
n/a
n/a
# Two or more races Students
592 Students
240,557 Students
% of Two or more races Students
6%
6%
Students by Grade:
# Students in PK Grade:
-
83
# Students in K Grade:
851
519,574
# Students in 1st Grade:
613
396,601
# Students in 2nd Grade:
608
414,466
# Students in 3rd Grade:
634
416,628
# Students in 4th Grade:
688
426,360
# Students in 5th Grade:
681
430,582
# Students in 6th Grade:
695
432,936
# Students in 7th Grade:
725
312,207
# Students in 8th Grade:
778
312,649
# Students in 9th Grade:
793
44,929
# Students in 10th Grade:
804
37,487
# Students in 11th Grade:
873
37,249
# Students in 12th Grade:
876
41,169
# Ungraded Students:
-
-
District Revenue and Spending
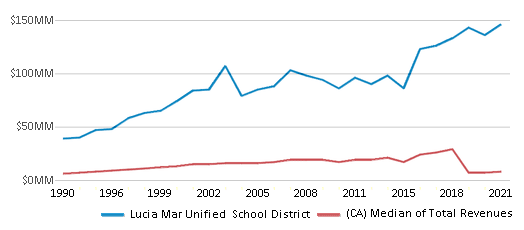
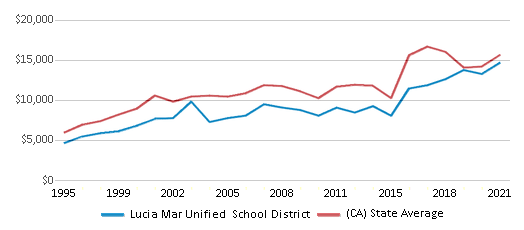
The revenue/student of $15,135 in this school district is less than the state median of $19,974. The school district revenue/student has stayed relatively flat over four school years.
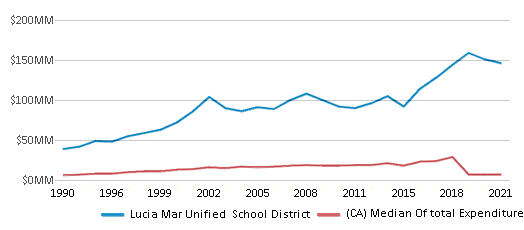
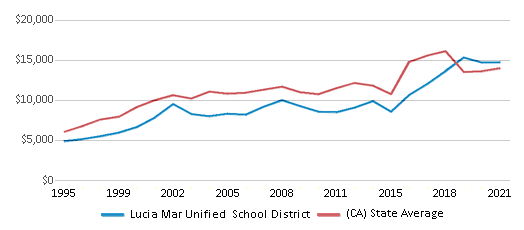
The school district's spending/student of $15,186 is less than the state median of $18,396. The school district spending/student has stayed relatively flat over four school years.
Total Revenue
$146 MM
$116,387 MM
Spending
$146 MM
$107,188 MM
Revenue / Student
$15,135
$19,974
Spending / Student
$15,186
$18,396
Best Lucia Mar Unified School District Public Elementary Schools (2025)
School
(Math and Reading Proficiency)
(Math and Reading Proficiency)
Location
Grades
Students
Rank: #11.
Ocean View Elementary School
(Math: 57% | Reading: 69%)
Rank:
Rank:
9/
Top 20%10
1208 Linda Dr.
Arroyo Grande, CA 93420
(805) 474-3730
Arroyo Grande, CA 93420
(805) 474-3730
Grades: K-6
| 527 students
Rank: #22.
Shell Beach Elementary School
(Math: 66% | Reading: 60-64%)
Rank:
Rank:
9/
Top 20%10
2100 Shell Beach Rd.
Pismo Beach, CA 93449
(805) 474-3760
Pismo Beach, CA 93449
(805) 474-3760
Grades: K-6
| 347 students
Rank: #33.
Branch Elementary School
(Math: 50-54% | Reading: 60-64%)
Rank:
Rank:
9/
Top 20%10
970 School Rd.
Arroyo Grande, CA 93420
(805) 474-3720
Arroyo Grande, CA 93420
(805) 474-3720
Grades: K-6
| 254 students
Rank: #44.
Harloe Elementary School
(Math: 43% | Reading: 55%)
Rank:
Rank:
8/
Top 30%10
901 Fair Oaks Ave.
Arroyo Grande, CA 93420
(805) 474-3710
Arroyo Grande, CA 93420
(805) 474-3710
Grades: K-6
| 605 students
Rank: #55.
Fairgrove Elementary School
(Math: 36% | Reading: 43%)
Rank:
Rank:
6/
Top 50%10
2101 The Pike
Grover Beach, CA 93433
(805) 474-3740
Grover Beach, CA 93433
(805) 474-3740
Grades: K-6
| 369 students
Rank: #66.
Pacific View Academy
Alternative School
(Math: 25-29% | Reading: 45-49%)
Rank:
Rank:
6/
Top 50%10
1065 Mesa View Dr.
Arroyo Grande, CA 93420
(805) 474-3580
Arroyo Grande, CA 93420
(805) 474-3580
Grades: K-12
| 135 students
Rank: #77.
Grover Heights Elementary School
(Math: 30% | Reading: 41%)
Rank:
Rank:
6/
Top 50%10
770 North Eighth St.
Grover Beach, CA 93433
(805) 474-3700
Grover Beach, CA 93433
(805) 474-3700
Grades: K-6
| 301 students
Rank: #88.
Lange (Dorothea) Elementary School
(Math: 29% | Reading: 41%)
Rank:
Rank:
6/
Top 50%10
1661 Via Alta Mesa
Nipomo, CA 93444
(805) 474-3670
Nipomo, CA 93444
(805) 474-3670
Grades: K-6
| 566 students
Rank: #99.
Oceano Elementary School
(Math: 28% | Reading: 38%)
Rank:
Rank:
5/
Bottom 50%10
1551 17th St.
Oceano, CA 93445
(805) 474-3800
Oceano, CA 93445
(805) 474-3800
Grades: K-6
| 393 students
Rank: #1010.
Dana Elementary School
(Math: 25% | Reading: 34%)
Rank:
Rank:
5/
Bottom 50%10
920 West Tefft St.
Nipomo, CA 93444
(805) 474-3790
Nipomo, CA 93444
(805) 474-3790
Grades: K-6
| 601 students
Rank: #1111.
Grover Beach Elementary School
(Math: 18% | Reading: 34%)
Rank:
Rank:
4/
Bottom 50%10
365 South 10th St.
Grover Beach, CA 93433
(805) 474-3770
Grover Beach, CA 93433
(805) 474-3770
Grades: K-6
| 402 students
Rank: #1212.
Nipomo Elementary School
(Math: 16% | Reading: 34%)
Rank:
Rank:
3/
Bottom 50%10
190 East Price St.
Nipomo, CA 93444
(805) 474-3780
Nipomo, CA 93444
(805) 474-3780
Grades: K-6
| 386 students
Recent Articles

Sexual Harassment at Age 6: The Tale of a First Grade Suspension
A six-year old in Aurora, Colorado, was suspended after singing an LMFAO song to a little girl in his class and reportedly “shaking his booty.” We look at the case and the sexual harassment problem in public schools today.

How Scaffolding Could Change the Way Your Child Learns
This article explores the concept of instructional scaffolding, a teaching method that enhances learning by breaking down complex tasks into manageable parts. It highlights how scaffolding supports students in developing critical thinking skills and becoming more independent learners. The article discusses the benefits of scaffolding, including improved engagement and reduced anxiety, and provides strategies for its implementation across various educational levels.

February 05, 2025
Understanding the U.S. Department of Education: Structure, Impact, and EvolutionWe explore how the Department of Education shapes American education, from its cabinet-level leadership to its impact on millions of students, written for general audiences seeking clarity on this vital institution.


