For the 2025 school year, there are 7 public elementary schools serving 1,176 students in Mariposa County Unified School District. This district's average elementary testing ranking is 5/10, which is in the bottom 50% of public elementary schools in California.
Public Elementary Schools in Mariposa County Unified School District have an average math proficiency score of 27% (versus the California public elementary school average of 35%), and reading proficiency score of 36% (versus the 45% statewide average).
Minority enrollment is 41% of the student body (majority Hispanic), which is less than the California public elementary school average of 79% (majority Hispanic).
Overview
This School District
This State (CA)
# Schools
11 Schools
7,700 Schools
# Students
1,669 Students
3,822,920 Students
# Teachers
88 Teachers
174,000 Teachers
Student : Teacher Ratio
19:1
19:1
District Rank
Mariposa County Unified School District, which is ranked #1091 of all 1,925 school districts in California (based off of combined math and reading proficiency testing data) for the 2021-2022 school year.
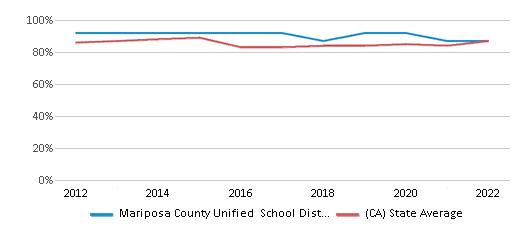
The school district's graduation rate of 85-89% has decreased from 90-94% over five school years.
Overall District Rank
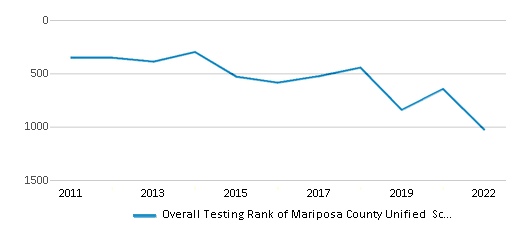
#1028 out of 1941 school districts
(Bottom 50%)
(Bottom 50%)
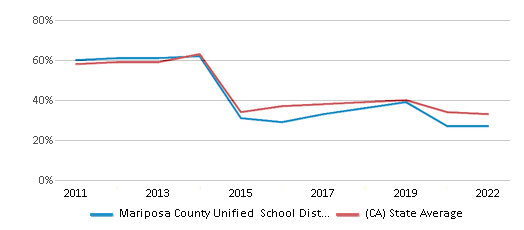
Math Test Scores (% Proficient)
27%
33%
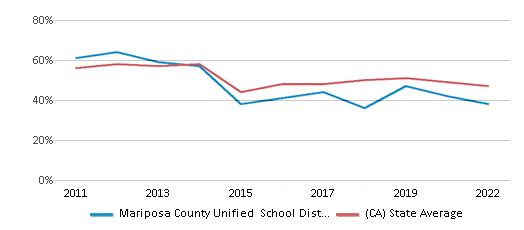
Reading/Language Arts Test Scores (% Proficient)
38%
47%
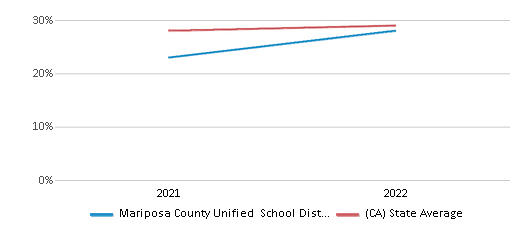
Science Test Scores (% Proficient)
28%
29%
Graduation Rate
85-89%
87%
Students by Ethnicity:
Diversity Score
0.57
0.64
# American Indian Students
56 Students
16,785 Students
% American Indian Students
4%
1%
# Asian Students
17 Students
454,357 Students
% Asian Students
1%
12%
# Hispanic Students
416 Students
2,114,366 Students
% Hispanic Students
25%
55%
# Black Students
17 Students
189,461 Students
% Black Students
1%
5%
# White Students
1,007 Students
787,389 Students
% White Students
60%
21%
# Hawaiian Students
2 Students
15,077 Students
% Hawaiian Students
n/a
n/a
# Two or more races Students
147 Students
240,557 Students
% of Two or more races Students
9%
6%
Students by Grade:
# Students in PK Grade:
-
83
# Students in K Grade:
145
519,574
# Students in 1st Grade:
126
396,601
# Students in 2nd Grade:
118
414,466
# Students in 3rd Grade:
119
416,628
# Students in 4th Grade:
126
426,360
# Students in 5th Grade:
127
430,582
# Students in 6th Grade:
124
432,936
# Students in 7th Grade:
130
312,207
# Students in 8th Grade:
125
312,649
# Students in 9th Grade:
128
44,929
# Students in 10th Grade:
160
37,487
# Students in 11th Grade:
119
37,249
# Students in 12th Grade:
122
41,169
# Ungraded Students:
-
-
District Revenue and Spending
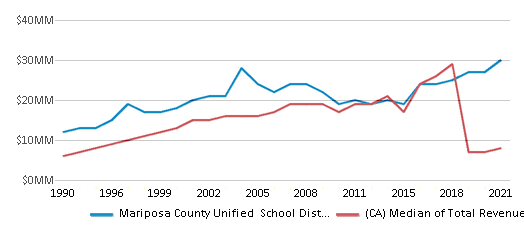
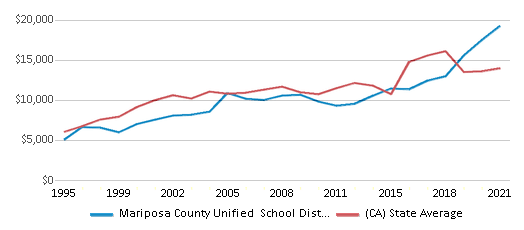
The revenue/student of $17,727 in this school district is less than the state median of $19,974. The school district revenue/student has stayed relatively flat over four school years.
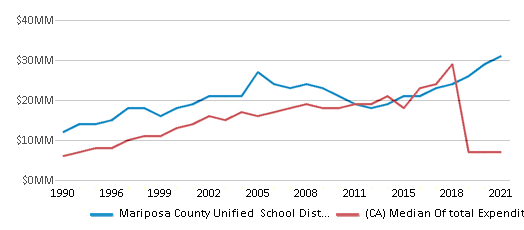
The school district's spending/student of $18,515 is higher than the state median of $18,396. The school district spending/student has stayed relatively flat over four school years.
Total Revenue
$30 MM
$116,387 MM
Spending
$31 MM
$107,188 MM
Revenue / Student
$17,727
$19,974
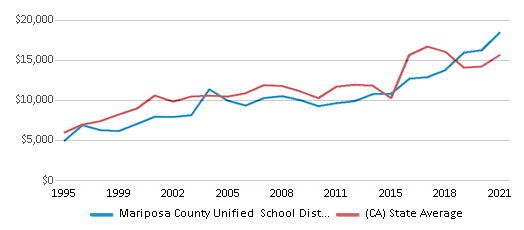
Spending / Student
$18,515
$18,396
Best Mariposa County Unified School District Public Elementary Schools (2025)
School
(Math and Reading Proficiency)
(Math and Reading Proficiency)
Location
Grades
Students
Rank: #11.
Yosemite National Park Valley Elementary School
(Math: ≥50% | Reading: ≥50%)
Rank:
Rank:
8/
Top 30%10
9009 Lost Arrow Loop
Yosemite National Park, CA 95389
(209) 372-4791
Yosemite National Park, CA 95389
(209) 372-4791
Grades: K-8
| 22 students
Rank: #22.
Yosemite National Park El Portal
(Math: 30-39% | Reading: 50-59%)
Rank:
Rank:
7/
Top 50%10
9670 Rancheria Flat Rd.
El Portal, CA 95318
(209) 379-2382
El Portal, CA 95318
(209) 379-2382
Grades: K-8
| 53 students
Rank: #33.
Woodland Elementary School
(Math: 30% | Reading: 39%)
Rank:
Rank:
6/
Top 50%10
3394 Woodland Dr.
Mariposa, CA 95338
(209) 742-0310
Mariposa, CA 95338
(209) 742-0310
Grades: K-8
| 444 students
Rank: #44.
Mariposa Elementary School
(Math: 29% | Reading: 35%)
Rank:
Rank:
5/
Bottom 50%10
5044 Jones St.
Mariposa, CA 95338
(209) 742-0340
Mariposa, CA 95338
(209) 742-0340
Grades: K-8
| 383 students
Rank: #55.
Lake Don Pedro Elementary School
(Math: 15-19% | Reading: 30-34%)
Rank:
Rank:
3/
Bottom 50%10
2411 Hidalgo
La Grange, CA 95329
(209) 852-2144
La Grange, CA 95329
(209) 852-2144
Grades: K-8
| 178 students
Rank: #66.
Sierra Home
Alternative School
(Math: ≤20% | Reading: ≤20%)
Rank:
Rank:
2/
Bottom 50%10
5171 Silva Rd.
Mariposa, CA 95338
(209) 742-0290
Mariposa, CA 95338
(209) 742-0290
Grades: K-12
| 49 students
Rank: #77.
Greeley Hill Elementary School
(Math: 11-19% | Reading: 11-19%)
Rank:
Rank:
2/
Bottom 50%10
10326 Fiske Rd., Greeley Hill
Coulterville, CA 95311
(209) 878-3028
Coulterville, CA 95311
(209) 878-3028
Grades: K-8
| 47 students
Recent Articles

How Has the Pandemic Changed Public School?
After more than a year of remote learning, schools are finally returning to in-person instruction but how has the pandemic changed the face of public education and what will it look like moving forward?

Managing Stress and Moving Forward from the Pandemic
As more schools return to in-person learning, teachers and parents find themselves dealing with the trauma and stress created by the pandemic.

February 05, 2025
Understanding the U.S. Department of Education: Structure, Impact, and EvolutionWe explore how the Department of Education shapes American education, from its cabinet-level leadership to its impact on millions of students, written for general audiences seeking clarity on this vital institution.


