Top Rankings
Riverside Unified School District ranks among the top 20% of public school district in California for:
Category
Attribute
Community Size
Largest student body (number of students) (Top 1%)
For the 2025 school year, there are 49 public schools serving 38,830 students in Riverside Unified School District. This district's average testing ranking is 6/10, which is in the top 50% of public schools in California.
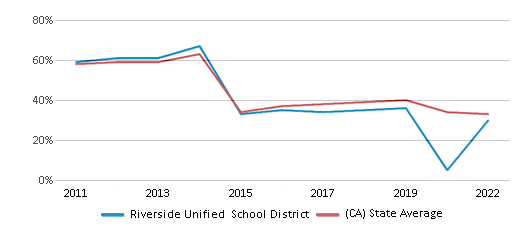
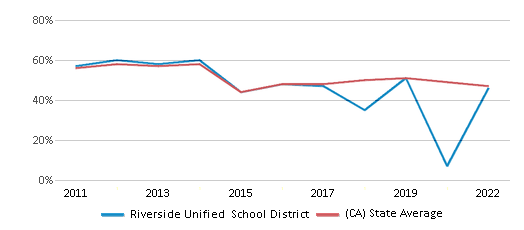
Public Schools in Riverside Unified School District have an average math proficiency score of 30% (versus the California public school average of 33%), and reading proficiency score of 46% (versus the 47% statewide average).
Minority enrollment is 84% of the student body (majority Hispanic), which is more than the California public school average of 80% (majority Hispanic).
Overview
This School District
This State (CA)
# Schools
49 Schools
10,369 Schools
# Students
38,830 Students
5,826,838 Students
# Teachers
1,680 Teachers
268,012 Teachers
Student : Teacher Ratio
23:1
23:1
District Rank
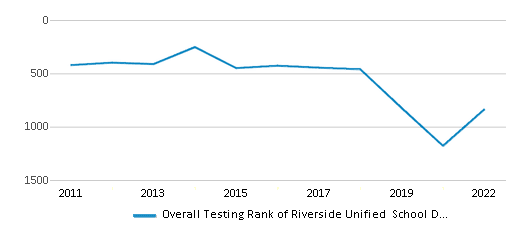
Riverside Unified School District, which is ranked #859 of all 1,925 school districts in California (based off of combined math and reading proficiency testing data) for the 2021-2022 school year.
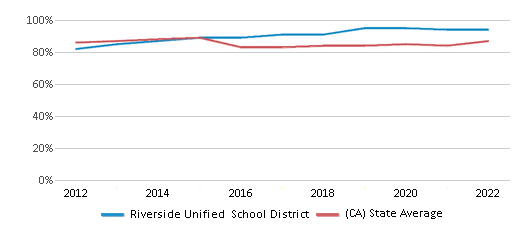
The school district's graduation rate of 94% has increased from 91% over five school years.
Overall District Rank
#835 out of 1941 school districts
(Top 50%)
(Top 50%)
Math Test Scores (% Proficient)
30%
33%
Reading/Language Arts Test Scores (% Proficient)
46%
47%
Science Test Scores (% Proficient)
26%
29%
Graduation Rate
94%
87%
Students by Ethnicity:
Diversity Score
0.50
0.63
# American Indian Students
105 Students
25,796 Students
% American Indian Students
n/a
1%
# Asian Students
1,919 Students
705,807 Students
% Asian Students
5%
12%
# Hispanic Students
26,777 Students
3,264,561 Students
% Hispanic Students
69%
56%
# Black Students
2,209 Students
286,112 Students
% Black Students
6%
5%
# White Students
6,246 Students
1,178,558 Students
% White Students
16%
20%
# Hawaiian Students
120 Students
23,731 Students
% Hawaiian Students
n/a
n/a
# Two or more races Students
1,421 Students
333,755 Students
% of Two or more races Students
4%
6%
Students by Grade:
# Students in PK Grade:
-
83
# Students in K Grade:
3,362
522,456
# Students in 1st Grade:
2,639
396,605
# Students in 2nd Grade:
2,811
414,466
# Students in 3rd Grade:
2,718
416,628
# Students in 4th Grade:
2,781
426,361
# Students in 5th Grade:
2,817
430,587
# Students in 6th Grade:
2,878
432,997
# Students in 7th Grade:
3,050
439,621
# Students in 8th Grade:
2,914
441,777
# Students in 9th Grade:
3,077
466,534
# Students in 10th Grade:
3,265
476,585
# Students in 11th Grade:
3,128
469,511
# Students in 12th Grade:
3,390
492,627
# Ungraded Students:
-
-
District Revenue and Spending
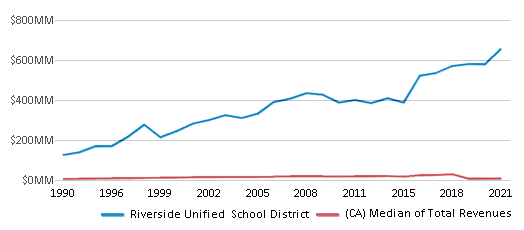
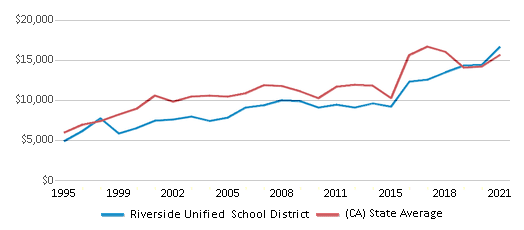
The revenue/student of $16,903 in this school district is less than the state median of $19,974. The school district revenue/student has stayed relatively flat over four school years.
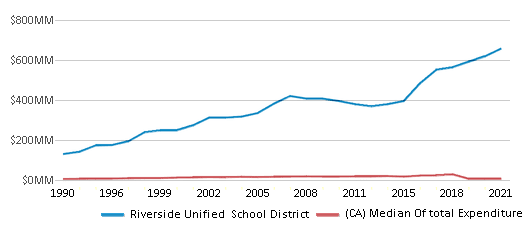
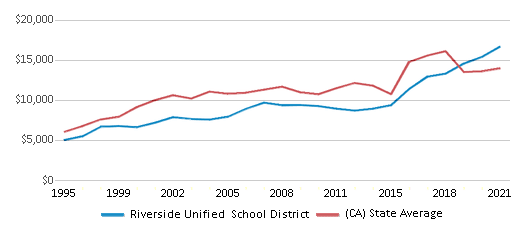
The school district's spending/student of $16,939 is less than the state median of $18,396. The school district spending/student has stayed relatively flat over four school years.
Total Revenue
$656 MM
$116,387 MM
Spending
$658 MM
$107,188 MM
Revenue / Student
$16,903
$19,974
Spending / Student
$16,939
$18,396
Best Riverside Unified School District Public Schools (2025)
School
(Math and Reading Proficiency)
(Math and Reading Proficiency)
Location
Grades
Students
Rank: #11.
Riverside Stem Academy
(Math: 82% | Reading: 87%)
Rank:
Rank:
10/
Top 5%10
4466 Mt.vernon Ave.
Riverside, CA 92507
(951) 788-7308
Riverside, CA 92507
(951) 788-7308
Grades: 5-12
| 659 students
Rank: #22.
Benjamin Franklin Elementary School
(Math: 62% | Reading: 60%)
Rank:
Rank:
9/
Top 20%10
19661 Orange Terrace Pkwy.
Riverside, CA 92508
(951) 571-6502
Riverside, CA 92508
(951) 571-6502
Grades: K-6
| 799 students
Rank: #33.
Martin Luther King Jr. High School
(Math: 42% | Reading: 79%)
Rank:
Rank:
9/
Top 20%10
9301 Wood Rd.
Riverside, CA 92508
(951) 789-5690
Riverside, CA 92508
(951) 789-5690
Grades: 9-12
| 2,813 students
Rank: #44.
Lake Mathews Elementary School
(Math: 50% | Reading: 61%)
Rank:
Rank:
9/
Top 20%10
12252 Blackburn Rd.
Riverside, CA 92503
(951) 352-5520
Riverside, CA 92503
(951) 352-5520
Grades: K-6
| 769 students
Rank: #55.
John F. Kennedy Elementary School
(Math: 50% | Reading: 58%)
Rank:
Rank:
8/
Top 30%10
19125 Schoolhouse Ln.
Riverside, CA 92508
(951) 789-7570
Riverside, CA 92508
(951) 789-7570
Grades: K-6
| 882 students
Rank: #66.
Mark Twain Elementary School
(Math: 49% | Reading: 58%)
Rank:
Rank:
8/
Top 30%10
19411 Krameria Ave.
Riverside, CA 92508
(951) 789-8170
Riverside, CA 92508
(951) 789-8170
Grades: K-6
| 1,038 students
Rank: #77.
Tomas Rivera Elementary School
(Math: 50% | Reading: 55%)
Rank:
Rank:
8/
Top 30%10
20440 Red Poppy Ln.
Riverside, CA 92508
(951) 697-5757
Riverside, CA 92508
(951) 697-5757
Grades: K-6
| 696 students
Rank: #88.
Frank Augustus Miller Middle School
(Math: 41% | Reading: 57%)
Rank:
Rank:
8/
Top 30%10
17925 Krameria Ave.
Riverside, CA 92504
(951) 789-8181
Riverside, CA 92504
(951) 789-8181
Grades: 7-8
| 844 students
Rank: #99.
Opportunity Program
Alternative School
(Math: <50% | Reading: <50%)
Rank:
Rank:
8/
Top 30%10
6401 Lincoln Ave.
Riverside, CA 92506
(951) 276-7670
Riverside, CA 92506
(951) 276-7670
Grades: 7-12
| 48 students
Rank: #1010.
Amelia Earhart Middle School
(Math: 38% | Reading: 59%)
Rank:
Rank:
8/
Top 30%10
20202 Aptos St.
Riverside, CA 92508
(951) 697-5700
Riverside, CA 92508
(951) 697-5700
Grades: 7-8
| 772 students
Rank: #1111.
Castle View Elementary School
(Math: 43% | Reading: 51%)
Rank:
Rank:
7/
Top 50%10
6201 Shaker Dr.
Riverside, CA 92506
(951) 788-7460
Riverside, CA 92506
(951) 788-7460
Grades: K-6
| 668 students
Rank: #1212.
Summit View Independent Study
Alternative School
(Math: 30-34% | Reading: 55-59%)
Rank:
Rank:
7/
Top 50%10
6401 Lincoln Ave.
Riverside, CA 92506
(951) 276-7670
Riverside, CA 92506
(951) 276-7670
Grades: K-12
| 86 students
Rank: #1313.
Pachappa Elementary School
(Math: 39% | Reading: 50%)
Rank:
Rank:
7/
Top 50%10
6200 Riverside Ave.
Riverside, CA 92506
(951) 788-7355
Riverside, CA 92506
(951) 788-7355
Grades: K-6
| 682 students
Rank: #1414.
Polytechnic High School
(Math: 24% | Reading: 66%)
Rank:
Rank:
7/
Top 50%10
5450 Victoria Ave.
Riverside, CA 92506
(951) 788-7203
Riverside, CA 92506
(951) 788-7203
Grades: 9-12
| 2,633 students
Rank: #1515.
Bryant Elementary School
(Math: 35-39% | Reading: 45-49%)
Rank:
Rank:
7/
Top 50%10
4324 Third St.
Riverside, CA 92501
(951) 788-7453
Riverside, CA 92501
(951) 788-7453
Grades: K-6
| 349 students
Rank: #1616.
Alcott Elementary School
(Math: 38% | Reading: 46%)
Rank:
Rank:
7/
Top 50%10
2433 Central Ave.
Riverside, CA 92506
(951) 788-7451
Riverside, CA 92506
(951) 788-7451
Grades: K-6
| 661 students
Rank: #1717.
Magnolia Elementary School
(Math: 34% | Reading: 45%)
Rank:
Rank:
6/
Top 50%10
3975 Maplewood Pl.
Riverside, CA 92506
(951) 788-7274
Riverside, CA 92506
(951) 788-7274
Grades: K-6
| 545 students
Rank: #1818.
Woodcrest Elementary School
(Math: 36% | Reading: 43%)
Rank:
Rank:
6/
Top 50%10
16940 Krameria Ave.
Riverside, CA 92504
(951) 776-4122
Riverside, CA 92504
(951) 776-4122
Grades: K-6
| 656 students
Rank: #1919.
Harrison Elementary School
(Math: 31% | Reading: 46%)
Rank:
Rank:
6/
Top 50%10
2901 Harrison St.
Riverside, CA 92503
(951) 352-6712
Riverside, CA 92503
(951) 352-6712
Grades: K-6
| 547 students
Rank: #20 - 2120. - 21.
Madison Elementary School
(Math: 32% | Reading: 42%)
Rank:
Rank:
6/
Top 50%10
3635 Madison St.
Riverside, CA 92504
(951) 352-8236
Riverside, CA 92504
(951) 352-8236
Grades: K-6
| 626 students
Rank: #20 - 2120. - 21.
Washington Elementary School
(Math: 32% | Reading: 42%)
Rank:
Rank:
6/
Top 50%10
2760 Jane St.
Riverside, CA 92506
(951) 788-7305
Riverside, CA 92506
(951) 788-7305
Grades: K-6
| 812 students
Rank: #2222.
Matthew Gage Middle School
(Math: 26% | Reading: 47%)
Rank:
Rank:
6/
Top 50%10
6400 Lincoln Ave.
Riverside, CA 92506
(951) 788-7350
Riverside, CA 92506
(951) 788-7350
Grades: 7-8
| 857 students
Rank: #2323.
William Howard Taft Elementary School
(Math: 32% | Reading: 40%)
Rank:
Rank:
6/
Top 50%10
959 Mission Grove Pkwy. North
Riverside, CA 92506
(951) 776-3018
Riverside, CA 92506
(951) 776-3018
Grades: K-6
| 596 students
Rank: #2424.
Victoria Elementary School
(Math: 28% | Reading: 42%)
Rank:
Rank:
6/
Top 50%10
2910 Arlington Ave.
Riverside, CA 92506
(951) 788-7441
Riverside, CA 92506
(951) 788-7441
Grades: K-6
| 475 students
Rank: #2525.
Arlington High School
(Math: 17% | Reading: 55%)
Rank:
Rank:
5/
Bottom 50%10
2951 Jackson St.
Riverside, CA 92503
(951) 352-8316
Riverside, CA 92503
(951) 352-8316
Grades: 9-12
| 1,967 students
Rank: #2626.
Monroe Elementary School
(Math: 30% | Reading: 38%)
Rank:
Rank:
5/
Bottom 50%10
8535 Garfield Ave.
Riverside, CA 92504
(951) 352-8241
Riverside, CA 92504
(951) 352-8241
Grades: K-6
| 578 students
Rank: #2727.
Adams Elementary School
(Math: 27% | Reading: 39%)
Rank:
Rank:
5/
Bottom 50%10
8362 Colorado Ave.
Riverside, CA 92504
(951) 352-6709
Riverside, CA 92504
(951) 352-6709
Grades: K-6
| 478 students
Rank: #2828.
Ramona High School
(Math: 20% | Reading: 47%)
Rank:
Rank:
5/
Bottom 50%10
7675 Magnolia Ave.
Riverside, CA 92504
(951) 352-8429
Riverside, CA 92504
(951) 352-8429
Grades: 9-12
| 2,190 students
Rank: #2929.
Riverside Virtual
(Math: 23% | Reading: 42%)
Rank:
Rank:
5/
Bottom 50%10
3380 14th St.
Riverside, CA 92501
(951) 276-2006
Riverside, CA 92501
(951) 276-2006
Grades: K-12
| 737 students
Rank: #3030.
Hawthorne Elementary School
(Math: 23% | Reading: 38%)
Rank:
Rank:
5/
Bottom 50%10
2700 Irving St.
Riverside, CA 92503
(951) 352-6716
Riverside, CA 92503
(951) 352-6716
Grades: K-6
| 644 students
Rank: #3131.
Mountain View Elementary School
(Math: 27% | Reading: 32%)
Rank:
Rank:
5/
Bottom 50%10
6180 Streeter Ave.
Riverside, CA 92504
(951) 788-7433
Riverside, CA 92504
(951) 788-7433
Grades: K-6
| 827 students
Rank: #3232.
Longfellow Elementary School
(Math: 22% | Reading: 35%)
Rank:
Rank:
4/
Bottom 50%10
3610 Eucalyptus Ave.
Riverside, CA 92507
(951) 788-7335
Riverside, CA 92507
(951) 788-7335
Grades: K-6
| 698 students
Rank: #3333.
Patricia Beatty Elementary School
(Math: 23% | Reading: 34%)
Rank:
Rank:
4/
Bottom 50%10
4261 Latham Rd.
Riverside, CA 92501
(951) 276-2070
Riverside, CA 92501
(951) 276-2070
Grades: K-6
| 482 students
Rank: #3434.
John W. North High School
(Math: 12% | Reading: 48%)
Rank:
Rank:
4/
Bottom 50%10
1550 West Third St.
Riverside, CA 92507
(951) 788-7311
Riverside, CA 92507
(951) 788-7311
Grades: 9-12
| 2,089 students
Rank: #3535.
Central Middle School
(Math: 17% | Reading: 38%)
Rank:
Rank:
4/
Bottom 50%10
4795 Magnolia Ave.
Riverside, CA 92506
(951) 788-7282
Riverside, CA 92506
(951) 788-7282
Grades: 7-8
| 606 students
Show 14 more public schools in Riverside Unified School District (out of 49 total schools)
Loading...
Frequently Asked Questions
How many schools belong to Riverside Unified School District?
Riverside Unified School District manages 49 public schools serving 38,830 students.
What is the rank of Riverside Unified School District?
Riverside Unified School District is ranked #859 out of 1,925 school districts in California (top 50%) based off of combined math and reading proficiency testing data for the 2021-2022 school year. This district ranks in the top 20% of California school districts for: Largest student body (number of students) (Top 1%)
What is the racial composition of students in Riverside Unified School District?
69% of Riverside Unified School District students are Hispanic, 16% of students are White, 6% of students are Black, 5% of students are Asian, and 4% of students are Two or more races.
What is the student/teacher ratio of Riverside Unified School District?
Riverside Unified School District has a student/teacher ratio of 23:1, which is higher than the California state average of 22:1.
What is Riverside Unified School District's spending/student ratio?
The school district's spending/student of $16,939 is less than the state median of $18,396. The school district spending/student has stayed relatively flat over four school years.
Recent Articles

What Is A Charter School?
Explore the world of charter schools in this comprehensive guide. Learn about their history, how they operate, and the pros and cons of this educational innovation. Discover key facts about charter schools, including admission policies, demographics, and funding, as well as what to look for when considering a charter school for your child.

10 Reasons Why High School Sports Benefit Students
Discover the 10 compelling reasons why high school sports are beneficial for students. This comprehensive article explores how athletics enhance academic performance, foster personal growth, and develop crucial life skills. From improved fitness and time management to leadership development and community representation, learn why participating in high school sports can be a game-changer for students' overall success and well-being.

February 05, 2025
Understanding the U.S. Department of Education: Structure, Impact, and EvolutionWe explore how the Department of Education shapes American education, from its cabinet-level leadership to its impact on millions of students, written for general audiences seeking clarity on this vital institution.


