Top Rankings
San Bernardino City Unified School District ranks among the top 20% of public school district in California for:
Category
Attribute
Community Size
Largest student body (number of students) (Top 1%)
For the 2025 school year, there are 63 public elementary schools serving 30,076 students in San Bernardino City Unified School District. This district's average elementary testing ranking is 4/10, which is in the bottom 50% of public elementary schools in California.
Public Elementary Schools in San Bernardino City Unified School District have an average math proficiency score of 20% (versus the California public elementary school average of 35%), and reading proficiency score of 32% (versus the 45% statewide average).
Minority enrollment is 96% of the student body (majority Hispanic), which is more than the California public elementary school average of 79% (majority Hispanic).
Overview
This School District
This State (CA)
# Schools
76 Schools
7,700 Schools
# Students
44,606 Students
3,822,920 Students
# Teachers
2,164 Teachers
174,000 Teachers
Student : Teacher Ratio
21:1
21:1
District Rank
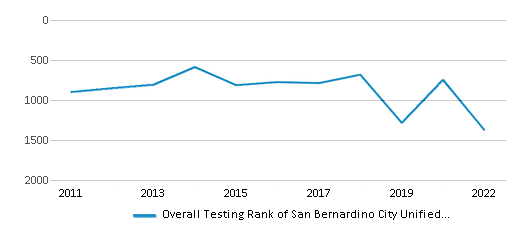
San Bernardino City Unified School District, which is ranked #1369 of all 1,925 school districts in California (based off of combined math and reading proficiency testing data) for the 2021-2022 school year.
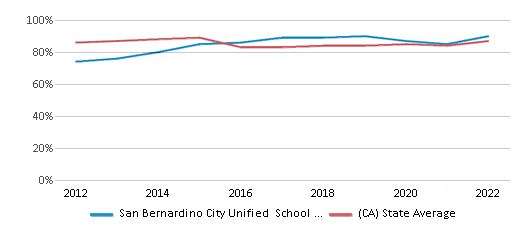
The school district's graduation rate of 90% has increased from 89% over five school years.
Overall District Rank
#1375 out of 1941 school districts
(Bottom 50%)
(Bottom 50%)
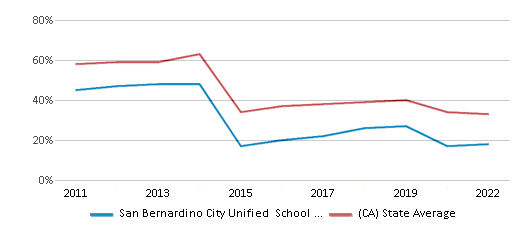
Math Test Scores (% Proficient)
18%
33%
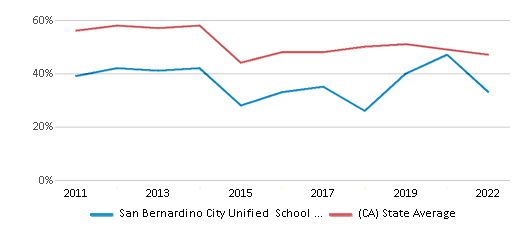
Reading/Language Arts Test Scores (% Proficient)
33%
47%
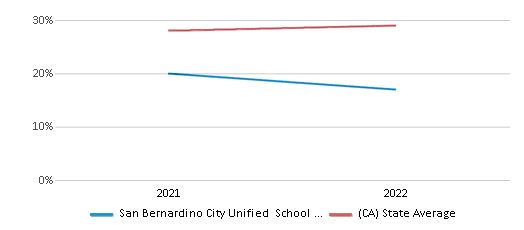
Science Test Scores (% Proficient)
17%
29%
Graduation Rate
90%
87%
Students by Ethnicity:
Diversity Score
0.30
0.64
# American Indian Students
116 Students
16,785 Students
% American Indian Students
n/a
1%
# Asian Students
784 Students
454,357 Students
% Asian Students
2%
12%
# Hispanic Students
37,041 Students
2,114,366 Students
% Hispanic Students
83%
55%
# Black Students
3,754 Students
189,461 Students
% Black Students
9%
5%
# White Students
1,769 Students
787,389 Students
% White Students
4%
21%
# Hawaiian Students
133 Students
15,077 Students
% Hawaiian Students
n/a
n/a
# Two or more races Students
1,001 Students
240,557 Students
% of Two or more races Students
2%
6%
Students by Grade:
# Students in PK Grade:
-
83
# Students in K Grade:
3,904
519,574
# Students in 1st Grade:
3,346
396,601
# Students in 2nd Grade:
3,575
414,466
# Students in 3rd Grade:
3,507
416,628
# Students in 4th Grade:
3,551
426,360
# Students in 5th Grade:
3,560
430,582
# Students in 6th Grade:
3,525
432,936
# Students in 7th Grade:
3,403
312,207
# Students in 8th Grade:
3,428
312,649
# Students in 9th Grade:
3,084
44,929
# Students in 10th Grade:
3,152
37,487
# Students in 11th Grade:
3,089
37,249
# Students in 12th Grade:
3,482
41,169
# Ungraded Students:
-
-
District Revenue and Spending
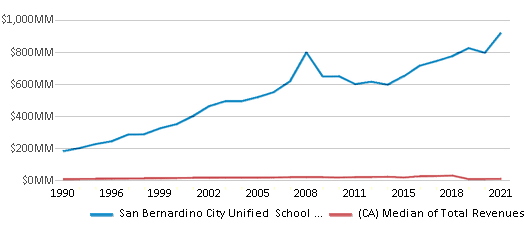
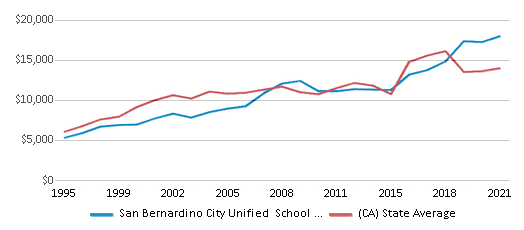
The revenue/student of $20,633 is higher than the state median of $19,974. The school district revenue/student has stayed relatively flat over four school years.
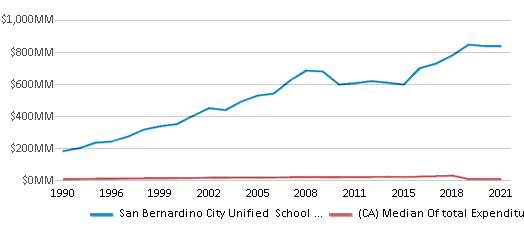
The school district's spending/student of $18,755 is higher than the state median of $18,396. The school district spending/student has stayed relatively flat over four school years.
Total Revenue
$920 MM
$116,387 MM
Spending
$837 MM
$107,188 MM
Revenue / Student
$20,633
$19,974
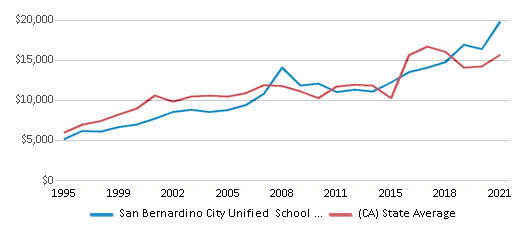
Spending / Student
$18,755
$18,396
Best San Bernardino City Unified School District Public Elementary Schools (2025)
School
(Math and Reading Proficiency)
(Math and Reading Proficiency)
Location
Grades
Students
Rank: #11.
Richardson Prep Hi Middle School
(Math: 71% | Reading: 81%)
Rank:
Rank:
10/
Top 5%10
455 South K St.
San Bernardino, CA 92410
(909) 388-6438
San Bernardino, CA 92410
(909) 388-6438
Grades: 6-8
| 595 students
Rank: #22.
Colonel Joseph C. Rodriguez Prep Academy
(Math: 45% | Reading: 70%)
Rank:
Rank:
9/
Top 20%10
1985 North Guthrie St.
San Bernardino, CA 92404
(909) 884-6030
San Bernardino, CA 92404
(909) 884-6030
Grades: 6-8
| 699 students
Rank: #33.
Hillside Elementary School
(Math: 45% | Reading: 68%)
Rank:
Rank:
9/
Top 20%10
4975 North Mayfield Ave.
San Bernardino, CA 92407
(909) 881-8264
San Bernardino, CA 92407
(909) 881-8264
Grades: K-6
| 601 students
Rank: #44.
Paakuma K-8
(Math: 40% | Reading: 53%)
Rank:
Rank:
7/
Top 50%10
17875 Sycamore Creek Loop Pkwy
San Bernardino, CA 92407
(909) 355-3137
San Bernardino, CA 92407
(909) 355-3137
Grades: K-8
| 984 students
Rank: #55.
Anderson
Special Education School
(Math: <50% | Reading: <50% )
Rank:
Rank:
7/
Top 50%10
24302 East Fourth St.
San Bernardino, CA 92410
(909) 388-6311
San Bernardino, CA 92410
(909) 388-6311
Grades: K-12
| 73 students
Rank: #66.
Kimbark Elementary School
(Math: 35-39% | Reading: 45-49%)
Rank:
Rank:
7/
Top 50%10
18021 West Kenwood Ave.
San Bernardino, CA 92407
(909) 880-6641
San Bernardino, CA 92407
(909) 880-6641
Grades: K-6
| 333 students
Rank: #77.
North Verdemont Elementary School
(Math: 32% | Reading: 46%)
Rank:
Rank:
6/
Top 50%10
3555 West Meyers Rd.
San Bernardino, CA 92407
(909) 880-6730
San Bernardino, CA 92407
(909) 880-6730
Grades: K-6
| 528 students
Rank: #88.
North Park Elementary School
(Math: 31% | Reading: 43%)
Rank:
Rank:
6/
Top 50%10
5378 North H St.
San Bernardino, CA 92407
(909) 881-8202
San Bernardino, CA 92407
(909) 881-8202
Grades: K-6
| 514 students
Rank: #99.
Palm Avenue Elementary School
(Math: 29% | Reading: 44%)
Rank:
Rank:
6/
Top 50%10
6565 Palm Ave.
San Bernardino, CA 92407
(909) 880-6753
San Bernardino, CA 92407
(909) 880-6753
Grades: K-6
| 479 students
Rank: #1010.
Roosevelt Elementary School
(Math: 30-34% | Reading: 35-39%)
Rank:
Rank:
6/
Top 50%10
1554 Garner Ave.
San Bernardino, CA 92411
(909) 388-6470
San Bernardino, CA 92411
(909) 388-6470
Grades: K-3
| 524 students
Rank: #1111.
Ramona-alessandro Elementary School
(Math: 29% | Reading: 41%)
Rank:
Rank:
6/
Top 50%10
670 Ramona Ave.
San Bernardino, CA 92411
(909) 388-6300
San Bernardino, CA 92411
(909) 388-6300
Grades: K-6
| 471 students
Rank: #1212.
Vermont Elementary School
(Math: 29% | Reading: 38%)
Rank:
Rank:
5/
Bottom 50%10
3695 Vermont St.
San Bernardino, CA 92407
(909) 880-6658
San Bernardino, CA 92407
(909) 880-6658
Grades: K-6
| 661 students
Rank: #1313.
Riley Elementary School
(Math: 33% | Reading: 32%)
Rank:
Rank:
5/
Bottom 50%10
1266 North G St.
San Bernardino, CA 92405
(909) 388-6460
San Bernardino, CA 92405
(909) 388-6460
Grades: K-5
| 472 students
Rank: #14 - 1514. - 15.
Manuel A. Salinas Creative Arts Elementary School
(Math: 28% | Reading: 33%)
Rank:
Rank:
5/
Bottom 50%10
2699 North California St.
San Bernardino, CA 92407
(909) 880-6600
San Bernardino, CA 92407
(909) 880-6600
Grades: K-5
| 422 students
Rank: #14 - 1514. - 15.
Thompson Elementary School
(Math: 28% | Reading: 33%)
Rank:
Rank:
5/
Bottom 50%10
7401 Church Ave.
Highland, CA 92346
(909) 388-6512
Highland, CA 92346
(909) 388-6512
Grades: K-6
| 451 students
Rank: #1616.
Belvedere Elementary School
(Math: 26% | Reading: 36%)
Rank:
Rank:
5/
Bottom 50%10
2501 East Marshall Blvd.
Highland, CA 92346
(909) 862-7111
Highland, CA 92346
(909) 862-7111
Grades: K-6
| 564 students
Rank: #1717.
Bradley Elementary School
(Math: 26% | Reading: 35%)
Rank:
Rank:
5/
Bottom 50%10
1300 Valencia Ave.
San Bernardino, CA 92404
(909) 388-6317
San Bernardino, CA 92404
(909) 388-6317
Grades: K-6
| 543 students
Rank: #1818.
Emmerton Elementary School
(Math: 19% | Reading: 35%)
Rank:
Rank:
4/
Bottom 50%10
1888 Arden Ave.
San Bernardino, CA 92404
(909) 388-6522
San Bernardino, CA 92404
(909) 388-6522
Grades: K-5
| 467 students
Rank: #1919.
Dr. Mildred Dalton Henry Elementary School
(Math: 21% | Reading: 30%)
Rank:
Rank:
4/
Bottom 50%10
1250 West 14th St.
San Bernardino, CA 92411
(909) 888-2353
San Bernardino, CA 92411
(909) 888-2353
Grades: 4-6
| 341 students
Rank: #2020.
Urbita Elementary School
(Math: 21% | Reading: 29%)
Rank:
Rank:
4/
Bottom 50%10
771 South J St.
San Bernardino, CA 92410
(909) 388-6488
San Bernardino, CA 92410
(909) 388-6488
Grades: K-6
| 390 students
Rank: #2121.
Marshall Elementary School
(Math: 15-19% | Reading: 30-34%)
Rank:
Rank:
3/
Bottom 50%10
3288 North G St.
San Bernardino, CA 92405
(909) 881-8185
San Bernardino, CA 92405
(909) 881-8185
Grades: K-6
| 390 students
Rank: #2222.
Cypress Elementary School
(Math: 20% | Reading: 29%)
Rank:
Rank:
3/
Bottom 50%10
26825 Cypress St.
Highland, CA 92346
(909) 388-6514
Highland, CA 92346
(909) 388-6514
Grades: K-6
| 496 students
Rank: #2323.
Fairfax Elementary School
(Math: 19% | Reading: 31%)
Rank:
Rank:
3/
Bottom 50%10
1362 Pacific St.
San Bernardino, CA 92404
(909) 381-1283
San Bernardino, CA 92404
(909) 381-1283
Grades: K-6
| 323 students
Rank: #2424.
E. Neal Roberts Elementary School
(Math: 18% | Reading: 30%)
Rank:
Rank:
3/
Bottom 50%10
494 East Ninth St.
San Bernardino, CA 92410
(909) 388-6409
San Bernardino, CA 92410
(909) 388-6409
Grades: K-6
| 424 students
Rank: #2525.
Arrowview Middle School
(Math: 13% | Reading: 36%)
Rank:
Rank:
3/
Bottom 50%10
2299 North G St.
San Bernardino, CA 92405
(909) 881-8109
San Bernardino, CA 92405
(909) 881-8109
Grades: 6-8
| 922 students
Rank: #2626.
Muscoy Elementary School
(Math: 18% | Reading: 29%)
Rank:
Rank:
3/
Bottom 50%10
2119 West Blake St.
San Bernardino, CA 92407
(909) 880-6649
San Bernardino, CA 92407
(909) 880-6649
Grades: K-6
| 646 students
Rank: #2727.
Golden Valley Middle School
(Math: 12% | Reading: 36%)
Rank:
Rank:
3/
Bottom 50%10
3800 Waterman Ave.
San Bernardino, CA 92404
(909) 881-8168
San Bernardino, CA 92404
(909) 881-8168
Grades: 6-8
| 757 students
Rank: #2828.
Rio Vista Elementary School
(Math: 17% | Reading: 29%)
Rank:
Rank:
3/
Bottom 50%10
1451 North California St.
San Bernardino, CA 92411
(909) 388-6450
San Bernardino, CA 92411
(909) 388-6450
Grades: K-6
| 419 students
Rank: #2929.
Cesar E. Chavez Middle School
(Math: 16% | Reading: 31%)
Rank:
Rank:
3/
Bottom 50%10
6650 North Magnolia Ave.
San Bernardino, CA 92407
(909) 386-2050
San Bernardino, CA 92407
(909) 386-2050
Grades: 6-8
| 1,085 students
Rank: #3030.
Newmark Elementary School
(Math: 10-14% | Reading: 30-34%)
Rank:
Rank:
3/
Bottom 50%10
4121 North Third Ave.
San Bernardino, CA 92407
(909) 881-8192
San Bernardino, CA 92407
(909) 881-8192
Grades: K-6
| 398 students
Rank: #3131.
Oehl Elementary School
(Math: 16% | Reading: 27%)
Rank:
Rank:
3/
Bottom 50%10
2525 Palm Ave.
Highland, CA 92346
(909) 862-2261
Highland, CA 92346
(909) 862-2261
Grades: K-6
| 464 students
Rank: #3232.
Kendall Elementary School
(Math: 14% | Reading: 29%)
Rank:
Rank:
3/
Bottom 50%10
4951 State St.
San Bernardino, CA 92407
(909) 880-6626
San Bernardino, CA 92407
(909) 880-6626
Grades: K-5
| 372 students
Rank: #3333.
Bob Holcomb Elementary School
(Math: 18% | Reading: 22%)
Rank:
Rank:
3/
Bottom 50%10
1345 West 48th St.
San Bernardino, CA 92407
(909) 887-2505
San Bernardino, CA 92407
(909) 887-2505
Grades: K-6
| 585 students
Rank: #34 - 3534. - 35.
George Brown Jr. Elementary School
(Math: 15% | Reading: 25%)
Rank:
Rank:
2/
Bottom 50%10
2525 North G St.
San Bernardino, CA 92405
(909) 881-5010
San Bernardino, CA 92405
(909) 881-5010
Grades: K-6
| 781 students
Rank: #34 - 3534. - 35.
Lankershim Elementary School
(Math: 15% | Reading: 25%)
Rank:
Rank:
2/
Bottom 50%10
7499 Lankershim Ave.
Highland, CA 92346
(909) 862-4213
Highland, CA 92346
(909) 862-4213
Grades: K-6
| 527 students
Show 28 more public schools in San Bernardino City Unified School District (out of 63 total schools)
Loading...
Recent Articles

What Is A Charter School?
Explore the world of charter schools in this comprehensive guide. Learn about their history, how they operate, and the pros and cons of this educational innovation. Discover key facts about charter schools, including admission policies, demographics, and funding, as well as what to look for when considering a charter school for your child.

10 Reasons Why High School Sports Benefit Students
Discover the 10 compelling reasons why high school sports are beneficial for students. This comprehensive article explores how athletics enhance academic performance, foster personal growth, and develop crucial life skills. From improved fitness and time management to leadership development and community representation, learn why participating in high school sports can be a game-changer for students' overall success and well-being.

February 05, 2025
Understanding the U.S. Department of Education: Structure, Impact, and EvolutionWe explore how the Department of Education shapes American education, from its cabinet-level leadership to its impact on millions of students, written for general audiences seeking clarity on this vital institution.


