Top Rankings
Thermalito Union Elementary School District ranks among the top 20% of public school district in California for:
Category
Attribute
Diversity
Most diverse schools (Top 1%)
For the 2025 school year, there are 2 public middle schools serving 462 students in Thermalito Union Elementary School District. This district's average middle testing ranking is 3/10, which is in the bottom 50% of public middle schools in California.
Public Middle Schools in Thermalito Union Elementary School District have an average math proficiency score of 16% (versus the California public middle school average of 31%), and reading proficiency score of 31% (versus the 46% statewide average).
Minority enrollment is 64% of the student body (majority Asian), which is less than the California public middle school average of 78% (majority Hispanic).
Overview
This School District
This State (CA)
# Schools
6 Schools
3,501 Schools
# Students
1,520 Students
1,854,363 Students
# Teachers
69 Teachers
87,821 Teachers
Student : Teacher Ratio
22:1
22:1
District Rank
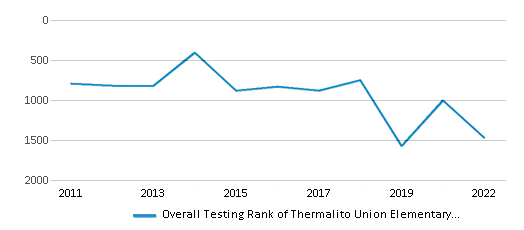
Thermalito Union Elementary School District, which is ranked #1439 of all 1,925 school districts in California (based off of combined math and reading proficiency testing data) for the 2021-2022 school year.
Overall District Rank
#1472 out of 1941 school districts
(Bottom 50%)
(Bottom 50%)
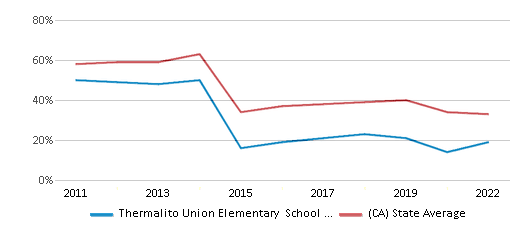
Math Test Scores (% Proficient)
19%
33%
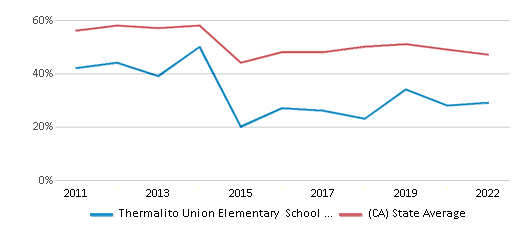
Reading/Language Arts Test Scores (% Proficient)
29%
47%
Science Test Scores (% Proficient)
20%
29%
Students by Ethnicity:
Diversity Score
0.73
0.64
# American Indian Students
36 Students
9,887 Students
% American Indian Students
2%
1%
# Asian Students
503 Students
201,760 Students
% Asian Students
33%
11%
# Hispanic Students
246 Students
1,009,980 Students
% Hispanic Students
16%
55%
# Black Students
33 Students
97,908 Students
% Black Students
2%
5%
# White Students
556 Students
413,325 Students
% White Students
37%
22%
# Hawaiian Students
6 Students
7,600 Students
% Hawaiian Students
1%
n/a
# Two or more races Students
140 Students
109,003 Students
% of Two or more races Students
9%
6%
Students by Grade:
# Students in PK Grade:
-
83
# Students in K Grade:
212
90,358
# Students in 1st Grade:
161
70,728
# Students in 2nd Grade:
160
73,359
# Students in 3rd Grade:
171
73,090
# Students in 4th Grade:
183
76,068
# Students in 5th Grade:
171
82,191
# Students in 6th Grade:
159
289,122
# Students in 7th Grade:
141
439,549
# Students in 8th Grade:
162
441,705
# Students in 9th Grade:
-
59,696
# Students in 10th Grade:
-
51,846
# Students in 11th Grade:
-
51,149
# Students in 12th Grade:
-
55,419
# Ungraded Students:
-
-
District Revenue and Spending
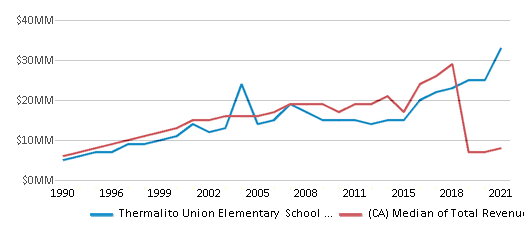
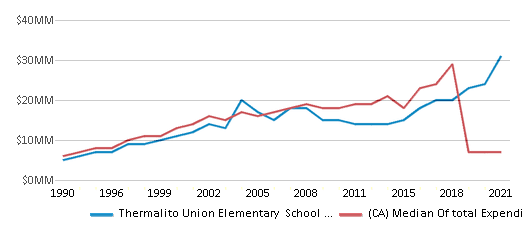
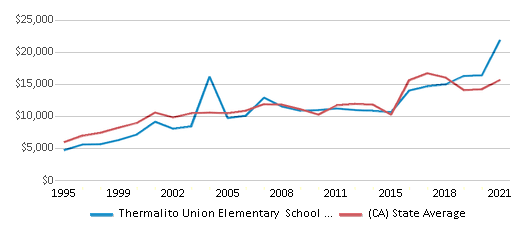
The revenue/student of $21,712 is higher than the state median of $19,974. The school district revenue/student has stayed relatively flat over four school years.
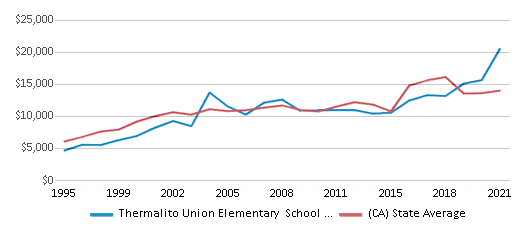
The school district's spending/student of $20,372 is higher than the state median of $18,396. The school district spending/student has stayed relatively flat over four school years.
Total Revenue
$33 MM
$116,387 MM
Spending
$31 MM
$107,188 MM
Revenue / Student
$21,712
$19,974
Spending / Student
$20,372
$18,396
Best Thermalito Union Elementary School District Public Middle Schools (2025)
School
(Math and Reading Proficiency)
(Math and Reading Proficiency)
Location
Grades
Students
Rank: #11.
Heritage Community Day
Alternative School
(Math: <50% | Reading: <50%)
Rank:
Rank:
8/
Top 30%10
2255 Sixth St.
Oroville, CA 95965
(530) 538-4376
Oroville, CA 95965
(530) 538-4376
Grades: 5-8
| 5 students
Rank: #22.
Nelson Avenue Middle School
(Math: 15% | Reading: 30%)
Rank:
Rank:
3/
Bottom 50%10
2255 Sixth St.
Oroville, CA 95965
(530) 538-2940
Oroville, CA 95965
(530) 538-2940
Grades: 6-8
| 457 students
Recent Articles

What Is A Charter School?
Explore the world of charter schools in this comprehensive guide. Learn about their history, how they operate, and the pros and cons of this educational innovation. Discover key facts about charter schools, including admission policies, demographics, and funding, as well as what to look for when considering a charter school for your child.

10 Reasons Why High School Sports Benefit Students
Discover the 10 compelling reasons why high school sports are beneficial for students. This comprehensive article explores how athletics enhance academic performance, foster personal growth, and develop crucial life skills. From improved fitness and time management to leadership development and community representation, learn why participating in high school sports can be a game-changer for students' overall success and well-being.

February 05, 2025
Understanding the U.S. Department of Education: Structure, Impact, and EvolutionWe explore how the Department of Education shapes American education, from its cabinet-level leadership to its impact on millions of students, written for general audiences seeking clarity on this vital institution.


