Top Rankings
Twin Rivers Unified School District ranks among the top 20% of public school district in California for:
Category
Attribute
Diversity
Most diverse schools (Top 1%)
Community Size
Largest student body (number of students) (Top 1%)
For the 2025 school year, there are 45 public schools serving 24,324 students in Twin Rivers Unified School District. This district's average testing ranking is 3/10, which is in the bottom 50% of public schools in California.
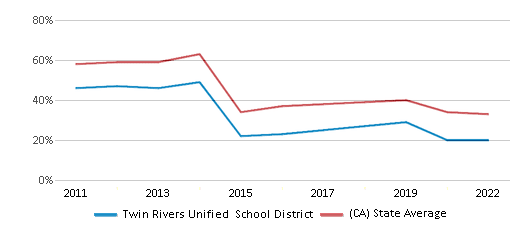
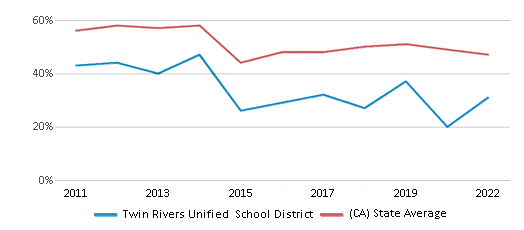
Public Schools in Twin Rivers Unified School District have an average math proficiency score of 20% (versus the California public school average of 33%), and reading proficiency score of 31% (versus the 47% statewide average).
Minority enrollment is 84% of the student body (majority Hispanic), which is more than the California public school average of 80% (majority Hispanic).
Overview
This School District
This State (CA)
# Schools
45 Schools
10,369 Schools
# Students
24,324 Students
5,826,838 Students
# Teachers
1,097 Teachers
268,012 Teachers
Student : Teacher Ratio
22:1
22:1
District Rank
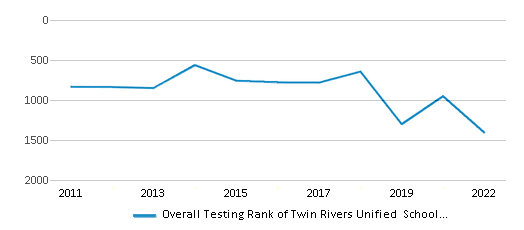
Twin Rivers Unified School District, which is ranked #1414 of all 1,925 school districts in California (based off of combined math and reading proficiency testing data) for the 2021-2022 school year.
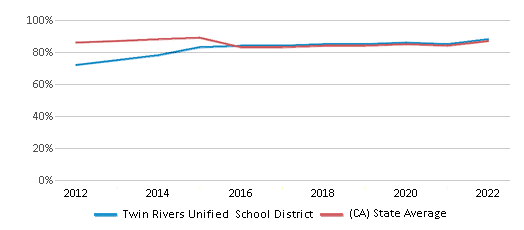
The school district's graduation rate of 88% has increased from 84% over five school years.
Overall District Rank
#1407 out of 1941 school districts
(Bottom 50%)
(Bottom 50%)
Math Test Scores (% Proficient)
20%
33%
Reading/Language Arts Test Scores (% Proficient)
31%
47%
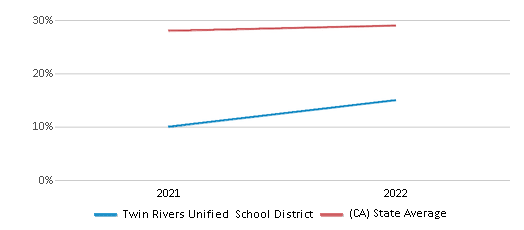
Science Test Scores (% Proficient)
15%
29%
Graduation Rate
88%
87%
Students by Ethnicity:
Diversity Score
0.72
0.63
# American Indian Students
116 Students
25,796 Students
% American Indian Students
n/a
1%
# Asian Students
3,552 Students
705,807 Students
% Asian Students
15%
12%
# Hispanic Students
11,356 Students
3,264,561 Students
% Hispanic Students
47%
56%
# Black Students
2,947 Students
286,112 Students
% Black Students
12%
5%
# White Students
3,776 Students
1,178,558 Students
% White Students
15%
20%
# Hawaiian Students
381 Students
23,731 Students
% Hawaiian Students
2%
n/a
# Two or more races Students
2,153 Students
333,755 Students
% of Two or more races Students
9%
6%
Students by Grade:
# Students in PK Grade:
-
83
# Students in K Grade:
2,307
522,456
# Students in 1st Grade:
1,800
396,605
# Students in 2nd Grade:
1,987
414,466
# Students in 3rd Grade:
1,876
416,628
# Students in 4th Grade:
1,912
426,361
# Students in 5th Grade:
2,032
430,587
# Students in 6th Grade:
1,918
432,997
# Students in 7th Grade:
2,000
439,621
# Students in 8th Grade:
1,902
441,777
# Students in 9th Grade:
1,642
466,534
# Students in 10th Grade:
1,669
476,585
# Students in 11th Grade:
1,589
469,511
# Students in 12th Grade:
1,690
492,627
# Ungraded Students:
-
-
District Revenue and Spending
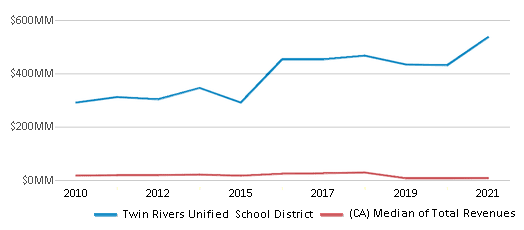
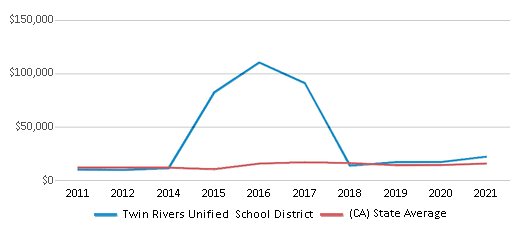
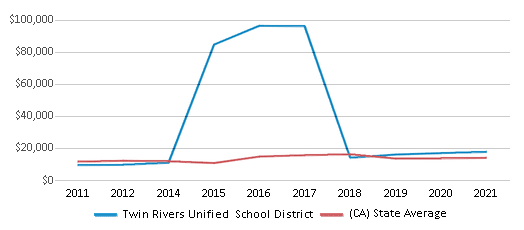
The revenue/student of $22,070 is higher than the state median of $19,974. The school district revenue/student has stayed relatively flat over four school years.
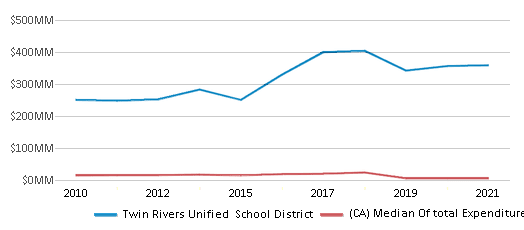
The school district's spending/student of $17,723 is less than the state median of $18,396. The school district spending/student has stayed relatively flat over four school years.
Total Revenue
$537 MM
$116,387 MM
Spending
$431 MM
$107,188 MM
Revenue / Student
$22,070
$19,974
Spending / Student
$17,723
$18,396
Best Twin Rivers Unified School District Public Schools (2025)
School
(Math and Reading Proficiency)
(Math and Reading Proficiency)
Location
Grades
Students
Rank: #11.
Regency Park Elementary School
(Math: 41% | Reading: 51%)
Rank:
Rank:
7/
Top 50%10
5901 Bridgecross Dr.
Sacramento, CA 95835
(916) 566-1660
Sacramento, CA 95835
(916) 566-1660
Grades: K-6
| 771 students
Rank: #22.
Foothill Oaks Elementary School
(Math: 41% | Reading: 49%)
Rank:
Rank:
7/
Top 50%10
5520 Lancelot Dr.
Sacramento, CA 95842
(916) 566-1830
Sacramento, CA 95842
(916) 566-1830
Grades: K-6
| 498 students
Rank: #33.
Westside Preparatory Charter
Charter School
(Math: 35% | Reading: 50%)
Rank:
Rank:
7/
Top 50%10
6537 West Second St.
Rio Linda, CA 95673
(916) 566-1990
Rio Linda, CA 95673
(916) 566-1990
Grades: 7-8
| 446 students
Rank: #44.
Garden Valley Elementary School
(Math: 30-34% | Reading: 45-49%)
Rank:
Rank:
6/
Top 50%10
3601 Larchwood Dr.
Sacramento, CA 95834
(916) 566-3460
Sacramento, CA 95834
(916) 566-3460
Grades: K-6
| 341 students
Rank: #55.
Ridgepoint Elementary School
(Math: 35% | Reading: 43%)
Rank:
Rank:
6/
Top 50%10
4680 Monument Dr.
Sacramento, CA 95842
(916) 566-1950
Sacramento, CA 95842
(916) 566-1950
Grades: K-8
| 667 students
Rank: #66.
Frontier Elementary School
(Math: 37% | Reading: 40%)
Rank:
Rank:
6/
Top 50%10
6691 Silverthorne Cir.
Sacramento, CA 95842
(916) 566-1840
Sacramento, CA 95842
(916) 566-1840
Grades: K-6
| 374 students
Rank: #77.
Creative Connections Arts Academy
Charter School
(Math: 31% | Reading: 45%)
Rank:
Rank:
6/
Top 50%10
7201 Arutas Dr.
North Highlands, CA 95660
(916) 566-1870
North Highlands, CA 95660
(916) 566-1870
Grades: K-12
| 705 students
Rank: #88.
Rio Linda High School
(Math: 27% | Reading: 46%)
Rank:
Rank:
6/
Top 50%10
6309 Dry Creek Rd.
Rio Linda, CA 95673
(916) 566-2725
Rio Linda, CA 95673
(916) 566-2725
Grades: 9-12
| 1,596 students
Rank: #99.
Pioneer Elementary School
(Math: 34% | Reading: 39%)
Rank:
Rank:
6/
Top 50%10
5816 Pioneer Way
Sacramento, CA 95841
(916) 566-1940
Sacramento, CA 95841
(916) 566-1940
Grades: K-8
| 643 students
Rank: #1010.
Westside Elementary School
(Math: 33% | Reading: 34%)
Rank:
Rank:
5/
Bottom 50%10
6537 West Second St.
Rio Linda, CA 95673
(916) 566-1990
Rio Linda, CA 95673
(916) 566-1990
Grades: K-6
| 376 students
Rank: #1111.
Hillsdale Elementary School
(Math: 30-34% | Reading: 30-34%)
Rank:
Rank:
5/
Bottom 50%10
6469 Guthrie Way
North Highlands, CA 95660
(916) 566-1860
North Highlands, CA 95660
(916) 566-1860
Grades: K-6
| 236 students
Rank: #1212.
Madison Elementary School
(Math: 27% | Reading: 36%)
Rank:
Rank:
5/
Bottom 50%10
5241 Harrison St.
North Highlands, CA 95660
(916) 566-1900
North Highlands, CA 95660
(916) 566-1900
Grades: K-6
| 745 students
Rank: #1313.
Hazel Strauch Elementary School
(Math: 25% | Reading: 37%)
Rank:
Rank:
5/
Bottom 50%10
3141 Northstead Dr.
Sacramento, CA 95833
(916) 566-2745
Sacramento, CA 95833
(916) 566-2745
Grades: K-6
| 590 students
Rank: #1414.
Warren A. Allison Elementary School
(Math: 20-24% | Reading: 35-39%)
Rank:
Rank:
5/
Bottom 50%10
4315 Don Julio Blvd.
North Highlands, CA 95660
(916) 566-1810
North Highlands, CA 95660
(916) 566-1810
Grades: K-6
| 389 students
Rank: #1515.
Dry Creek Elementary School
(Math: 29% | Reading: 29%)
Rank:
Rank:
4/
Bottom 50%10
1230 G St.
Rio Linda, CA 95673
(916) 566-1820
Rio Linda, CA 95673
(916) 566-1820
Grades: K-6
| 625 students
Rank: #1616.
Foothill High School
(Math: 14% | Reading: 47%)
Rank:
Rank:
4/
Bottom 50%10
5000 Mccloud Dr.
Sacramento, CA 95842
(916) 566-3445
Sacramento, CA 95842
(916) 566-3445
Grades: 9-12
| 1,289 students
Rank: #1717.
Smythe Academy Of Arts And Sciences
Charter School
(Math: 19% | Reading: 37%)
Rank:
Rank:
4/
Bottom 50%10
2781 Northgate Blvd.
Sacramento, CA 95833
(916) 566-2740
Sacramento, CA 95833
(916) 566-2740
Grades: K-8
| 1,133 students
Rank: #1818.
Sierra View Elementary School
(Math: 25-29% | Reading: 25-29%)
Rank:
Rank:
4/
Bottom 50%10
3638 Bainbridge Dr.
North Highlands, CA 95660
(916) 566-1960
North Highlands, CA 95660
(916) 566-1960
Grades: K-6
| 284 students
Rank: #1919.
Village Elementary School
(Math: 17% | Reading: 33%)
Rank:
Rank:
4/
Bottom 50%10
6845 Larchmont Dr.
North Highlands, CA 95660
(916) 566-1970
North Highlands, CA 95660
(916) 566-1970
Grades: K-8
| 456 students
Rank: #2020.
Las Palmas Elementary School
(Math: 20% | Reading: 28%)
Rank:
Rank:
3/
Bottom 50%10
477 Las Palmas Ave.
Sacramento, CA 95815
(916) 566-2700
Sacramento, CA 95815
(916) 566-2700
Grades: K-6
| 1,026 students
Rank: #2121.
Norwood Junior High School
(Math: 14% | Reading: 35%)
Rank:
Rank:
3/
Bottom 50%10
4601 Norwood Ave.
Sacramento, CA 95838
(916) 566-2710
Sacramento, CA 95838
(916) 566-2710
Grades: 7-8
| 458 students
Rank: #2222.
Orchard Elementary School
(Math: 15-19% | Reading: 25-29%)
Rank:
Rank:
3/
Bottom 50%10
1040 Q St.
Rio Linda, CA 95673
(916) 566-1930
Rio Linda, CA 95673
(916) 566-1930
Grades: K-6
| 320 students
Rank: #2323.
Del Paso Heights Elementary School
(Math: 18% | Reading: 25%)
Rank:
Rank:
3/
Bottom 50%10
590 Morey Ave.
Sacramento, CA 95838
(916) 566-3425
Sacramento, CA 95838
(916) 566-3425
Grades: K-6
| 469 students
Rank: #2424.
Kohler Elementary School
(Math: 15% | Reading: 29%)
Rank:
Rank:
3/
Bottom 50%10
4004 Bruce Way
North Highlands, CA 95660
(916) 566-1850
North Highlands, CA 95660
(916) 566-1850
Grades: K-8
| 374 students
Rank: #2525.
Rio Linda Preparatory Academy
(Math: 16% | Reading: 27%)
Rank:
Rank:
3/
Bottom 50%10
1101 G St.
Rio Linda, CA 95673
(916) 566-2720
Rio Linda, CA 95673
(916) 566-2720
Grades: 7-8
| 290 students
Rank: #2626.
Highlands High School
(Math: 10-14% | Reading: 25-29%)
Rank:
Rank:
2/
Bottom 50%10
6601 Guthrie Way
North Highlands, CA 95660
(916) 566-3465
North Highlands, CA 95660
(916) 566-3465
Grades: 9-12
| 754 students
Rank: #2727.
Fairbanks Elementary School
(Math: 15% | Reading: 23%)
Rank:
Rank:
2/
Bottom 50%10
227 Fairbanks Ave.
Sacramento, CA 95838
(916) 566-3435
Sacramento, CA 95838
(916) 566-3435
Grades: K-6
| 369 students
Rank: #2828.
Michael J. Castori Elementary School
(Math: 17% | Reading: 19%)
Rank:
Rank:
2/
Bottom 50%10
1801 South Ave.
Sacramento, CA 95838
(916) 566-3420
Sacramento, CA 95838
(916) 566-3420
Grades: K-6
| 558 students
Rank: #2929.
Grant Union High School
(Math: 11% | Reading: 28%)
Rank:
Rank:
2/
Bottom 50%10
1400 Grand Ave.
Sacramento, CA 95838
(916) 566-3450
Sacramento, CA 95838
(916) 566-3450
Grades: 9-12
| 2,016 students
Rank: #3030.
Foothill Ranch Middle School
(Math: 13% | Reading: 23%)
Rank:
Rank:
2/
Bottom 50%10
5001 Diablo Dr.
Sacramento, CA 95842
(916) 566-3440
Sacramento, CA 95842
(916) 566-3440
Grades: 7-8
| 493 students
Rank: #3131.
Rio Tierra Junior High School
(Math: 9% | Reading: 28%)
Rank:
Rank:
2/
Bottom 50%10
3201 Northstead Dr.
Sacramento, CA 95833
(916) 566-2730
Sacramento, CA 95833
(916) 566-2730
Grades: 7-8
| 303 students
Rank: #3232.
Nova Opportunity
(Math: ≤20% | Reading: ≤20% )
Rank:
Rank:
2/
Bottom 50%10
2035 N. Ave.
Sacramento, CA 95838
(916) 566-2765
Sacramento, CA 95838
(916) 566-2765
Grades: 7-9
| 6 students
Rank: #33 - 3433. - 34.
Northwood Elementary School
(Math: 10-14% | Reading: 20-24%)
Rank:
Rank:
2/
Bottom 50%10
2630 Taft St.
Sacramento, CA 95815
(916) 566-2705
Sacramento, CA 95815
(916) 566-2705
Grades: K-6
| 428 students
Rank: #33 - 3433. - 34.
Woodlake Elementary School
(Math: 10-14% | Reading: 20-24%)
Rank:
Rank:
2/
Bottom 50%10
700 Southgate Rd.
Sacramento, CA 95815
(916) 566-2755
Sacramento, CA 95815
(916) 566-2755
Grades: K-6
| 329 students
Rank: #3535.
Woodridge Elementary School
(Math: 12% | Reading: 18%)
Rank:
Rank:
1/
Bottom 50%10
5761 Brett Dr.
Sacramento, CA 95842
(916) 566-1650
Sacramento, CA 95842
(916) 566-1650
Grades: K-6
| 801 students
Show 10 more public schools in Twin Rivers Unified School District (out of 45 total schools)
Loading...
Frequently Asked Questions
How many schools belong to Twin Rivers Unified School District?
Twin Rivers Unified School District manages 45 public schools serving 24,324 students.
What is the rank of Twin Rivers Unified School District?
Twin Rivers Unified School District is ranked #1414 out of 1,925 school districts in California (bottom 50%) based off of combined math and reading proficiency testing data for the 2021-2022 school year. This district ranks in the top 20% of California school districts for: Most diverse schools (Top 1%) and Largest student body (number of students) (Top 1%)
What is the racial composition of students in Twin Rivers Unified School District?
47% of Twin Rivers Unified School District students are Hispanic, 15% of students are Asian, 15% of students are White, 12% of students are Black, 9% of students are Two or more races, and 2% of students are Hawaiian.
What is the student/teacher ratio of Twin Rivers Unified School District?
Twin Rivers Unified School District has a student/teacher ratio of 22:1, which is equal to the California state average of 22:1.
What is Twin Rivers Unified School District's spending/student ratio?
The school district's spending/student of $17,723 is less than the state median of $18,396. The school district spending/student has stayed relatively flat over four school years.
Recent Articles

What Is A Charter School?
Explore the world of charter schools in this comprehensive guide. Learn about their history, how they operate, and the pros and cons of this educational innovation. Discover key facts about charter schools, including admission policies, demographics, and funding, as well as what to look for when considering a charter school for your child.

10 Reasons Why High School Sports Benefit Students
Discover the 10 compelling reasons why high school sports are beneficial for students. This comprehensive article explores how athletics enhance academic performance, foster personal growth, and develop crucial life skills. From improved fitness and time management to leadership development and community representation, learn why participating in high school sports can be a game-changer for students' overall success and well-being.

February 05, 2025
Understanding the U.S. Department of Education: Structure, Impact, and EvolutionWe explore how the Department of Education shapes American education, from its cabinet-level leadership to its impact on millions of students, written for general audiences seeking clarity on this vital institution.


