Top Rankings
Red Clay Consolidated School District ranks among the top 20% of public school district in Delaware for:
Category
Attribute
Diversity
Most diverse schools (Top 1%)
Community Size
Largest student body (number of students) (Top 1%)
For the 2025 school year, there are 28 public schools serving 14,546 students in Red Clay Consolidated School District. This district's average testing ranking is 7/10, which is in the top 50% of public schools in Delaware.
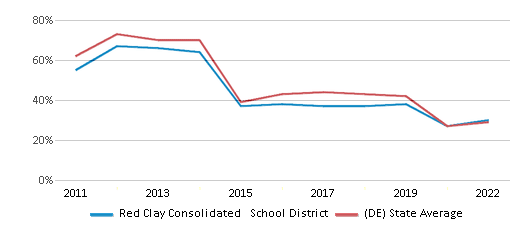
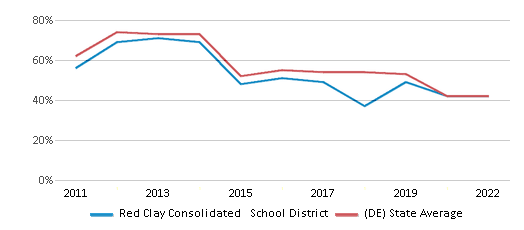
Public Schools in Red Clay Consolidated School District have an average math proficiency score of 30% (versus the Delaware public school average of 30%), and reading proficiency score of 42% (versus the 42% statewide average).
Minority enrollment is 63% of the student body (majority Hispanic), which is more than the Delaware public school average of 61% (majority Black).
Overview
This School District
This State (DE)
# Schools
28 Schools
235 Schools
# Students
14,546 Students
141,842 Students
# Teachers
1,073 Teachers
9,918 Teachers
Student : Teacher Ratio
14:1
14:1
District Rank
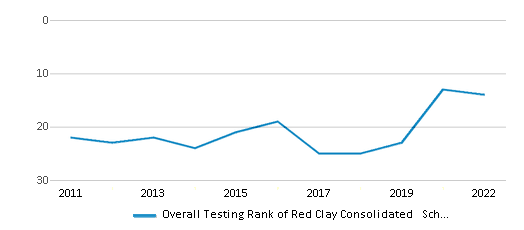
Red Clay Consolidated School District, which is ranked within the top 50% of all 42 school districts in Delaware (based off of combined math and reading proficiency testing data) for the 2021-2022 school year.
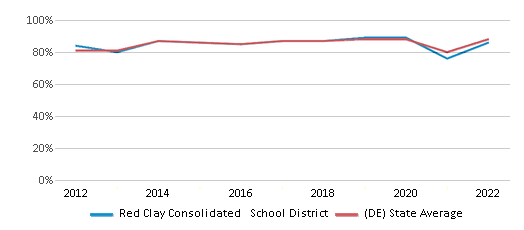
The school district's graduation rate of 86% has decreased from 87% over five school years.
Overall District Rank
#14 out of 42 school districts
(Top 50%)
(Top 50%)
Math Test Scores (% Proficient)
30%
29%
Reading/Language Arts Test Scores (% Proficient)
42%
42%
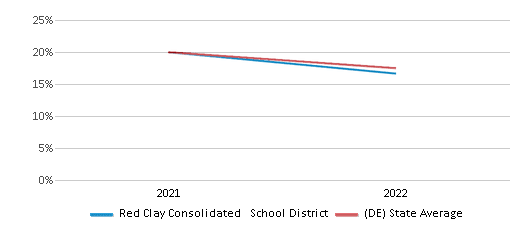
Science Test Scores (% Proficient)
20%
21%
Graduation Rate
86%
88%
Students by Ethnicity:
Diversity Score
0.72
0.71
# American Indian Students
41 Students
565 Students
% American Indian Students
n/a
n/a
# Asian Students
682 Students
6,270 Students
% Asian Students
5%
4%
# Hispanic Students
4,329 Students
27,772 Students
% Hispanic Students
30%
20%
# Black Students
3,461 Students
43,540 Students
% Black Students
24%
31%
# White Students
5,439 Students
55,789 Students
% White Students
37%
39%
# Hawaiian Students
12 Students
184 Students
% Hawaiian Students
n/a
n/a
# Two or more races Students
582 Students
7,722 Students
% of Two or more races Students
4%
6%
Students by Grade:
# Students in PK Grade:
289
2,529
# Students in K Grade:
1,096
9,762
# Students in 1st Grade:
1,135
10,002
# Students in 2nd Grade:
1,181
10,567
# Students in 3rd Grade:
1,188
10,146
# Students in 4th Grade:
1,153
10,192
# Students in 5th Grade:
1,177
10,635
# Students in 6th Grade:
1,244
10,737
# Students in 7th Grade:
1,285
10,869
# Students in 8th Grade:
1,311
11,046
# Students in 9th Grade:
972
12,652
# Students in 10th Grade:
890
11,668
# Students in 11th Grade:
813
10,819
# Students in 12th Grade:
812
10,218
# Ungraded Students:
-
-
District Revenue and Spending
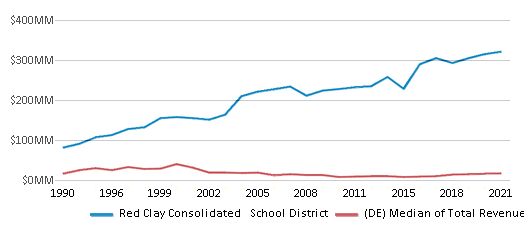
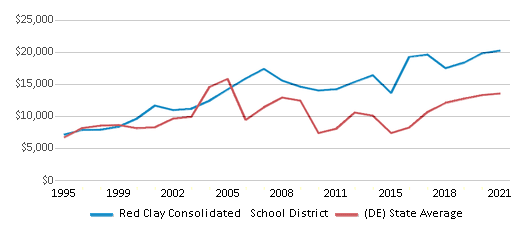
The revenue/student of $22,059 is higher than the state median of $20,321. The school district revenue/student has stayed relatively flat over four school years.
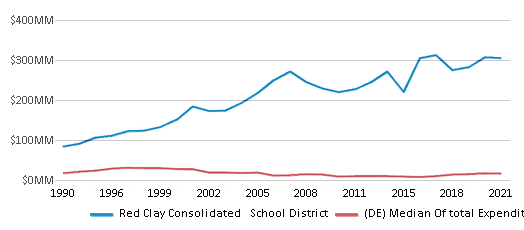
The school district's spending/student of $20,964 is higher than the state median of $18,401. The school district spending/student has stayed relatively flat over four school years.
Total Revenue
$321 MM
$2,882 MM
Spending
$305 MM
$2,610 MM
Revenue / Student
$22,059
$20,321
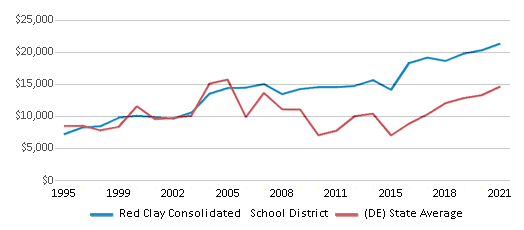
Spending / Student
$20,964
$18,401
Best Red Clay Consolidated School District Public Schools (2025)
School
(Math and Reading Proficiency)
(Math and Reading Proficiency)
Location
Grades
Students
Rank: #11.
North Star Elementary School
(Math: 74% | Reading: 77%)
Rank:
Rank:
10/
Top 1%10
1340 Little Baltimore Road
Hockessin, DE 19707
(302) 234-7200
Hockessin, DE 19707
(302) 234-7200
Grades: K-5
| 617 students
Rank: #22.
Linden Hill Elementary School
(Math: 65% | Reading: 68%)
Rank:
Rank:
10/
Top 5%10
3415 Skyline Drive
Wilmington, DE 19808
(302) 454-3406
Wilmington, DE 19808
(302) 454-3406
Grades: K-5
| 547 students
Rank: #33.
William F. Cooke Jr. Elementary School
(Math: 55% | Reading: 66%)
Rank:
Rank:
10/
Top 10%10
2025 Graves Road
Hockessin, DE 19707
(302) 235-6600
Hockessin, DE 19707
(302) 235-6600
Grades: K-5
| 615 students
Rank: #44.
Calloway (Cab) School Of The Arts
Magnet School
(Math: 46% | Reading: 76%)
Rank:
Rank:
9/
Top 20%10
100 North Dupont Road
Wilmington, DE 19807
(302) 651-2700
Wilmington, DE 19807
(302) 651-2700
Grades: 6-12
| 934 students
Rank: #55.
Conrad Schools Of Science
Magnet School
(Math: 44% | Reading: 65%)
Rank:
Rank:
9/
Top 20%10
201 Jackson Avenue
Wilmington, DE 19804
(302) 992-5545
Wilmington, DE 19804
(302) 992-5545
Grades: 6-12
| 1,163 students
Rank: #66.
Heritage Elementary School
(Math: 47% | Reading: 54%)
Rank:
Rank:
9/
Top 20%10
2815 Highlands Lane
Wilmington, DE 19808
(302) 454-3424
Wilmington, DE 19808
(302) 454-3424
Grades: K-5
| 493 students
Rank: #77.
First State School
Alternative School
(Math: <50% | Reading: <50%)
Rank:
Rank:
9/
Top 20%10
501 West 14th Street
Wilmington, DE 19899
(302) 320-5848
Wilmington, DE 19899
(302) 320-5848
Grades: K-10
| 18 students
Rank: #88.
Marbrook Elementary School
(Math: 43% | Reading: 53%)
Rank:
Rank:
8/
Top 30%10
2101 Centerville Road
Wilmington, DE 19808
(302) 992-5555
Wilmington, DE 19808
(302) 992-5555
Grades: K-5
| 431 students
Rank: #99.
Dupont (H.b.) Middle School
(Math: 40% | Reading: 54%)
Rank:
Rank:
8/
Top 30%10
735 Meeting House Road
Hockessin, DE 19707
(302) 239-3420
Hockessin, DE 19707
(302) 239-3420
Grades: 6-8
| 747 students
Rank: #1010.
Brandywine Springs School
(Math: 39% | Reading: 52%)
Rank:
Rank:
8/
Top 30%10
2916 Duncan Road
Wilmington, DE 19808
(302) 636-5681
Wilmington, DE 19808
(302) 636-5681
Grades: K-8
| 932 students
Rank: #1111.
Forest Oak Elementary School
(Math: 40% | Reading: 49%)
Rank:
Rank:
8/
Top 30%10
55 South Meadowood Drive
Newark, DE 19711
(302) 454-3420
Newark, DE 19711
(302) 454-3420
Grades: K-5
| 452 students
Rank: #1212.
Richardson Park Learning Center
Special Education School
(Math: <50% | Reading: <50% )
Rank:
Rank:
6/
Top 50%10
99 Middleboro Road
Wilmington, DE 19804
(302) 992-5574
Wilmington, DE 19804
(302) 992-5574
Grades: n/a
| n/a students
Rank: #1313.
Richey Elementary School
(Math: 30-34% | Reading: 35-39%)
Rank:
Rank:
5/
Bottom 50%10
105 East Highland Avenue
Wilmington, DE 19804
(302) 992-5535
Wilmington, DE 19804
(302) 992-5535
Grades: K-5
| 375 students
Rank: #1414.
Dickinson (John) School
(Math: 20% | Reading: 45%)
Rank:
Rank:
5/
Bottom 50%10
1801 Milltown Road
Wilmington, DE 19808
(302) 992-5500
Wilmington, DE 19808
(302) 992-5500
Grades: 6-12
| 1,032 students
Rank: #1515.
Baltz (Austin D.) Elementary School
(Math: 17% | Reading: 28%)
Rank:
Rank:
3/
Bottom 50%10
1500 Spruce Avenue
Wilmington, DE 19805
(302) 992-5560
Wilmington, DE 19805
(302) 992-5560
Grades: K-5
| 528 students
Rank: #1616.
Skyline Middle School
(Math: 12% | Reading: 24%)
Rank:
Rank:
2/
Bottom 50%10
2900 Skyline Drive
Wilmington, DE 19808
(302) 454-3410
Wilmington, DE 19808
(302) 454-3410
Grades: 6-8
| 472 students
Rank: #1717.
Dupont (Alexis I.) High School
(Math: 6-9% | Reading: 25-29%)
Rank:
Rank:
2/
Bottom 50%10
50 Hillside Road
Wilmington, DE 19807
(302) 651-2626
Wilmington, DE 19807
(302) 651-2626
Grades: 9-12
| 605 students
Rank: #1818.
Lewis (William C.) Dual Language Elementary School
(Math: 10-14% | Reading: 15-19%)
Rank:
Rank:
2/
Bottom 50%10
920 North Van Buren Street
Wilmington, DE 19806
(302) 651-2695
Wilmington, DE 19806
(302) 651-2695
Grades: K-5
| 316 students
Rank: #1919.
Shortlidge (Evan G.) Academy
(Math: 15-19% | Reading: 20-24% )
Rank:
Rank:
2/
Bottom 50%10
100 West 18th Street
Wilmington, DE 19802
(302) 651-2710
Wilmington, DE 19802
(302) 651-2710
Grades: K-2
| 394 students
Rank: #2020.
Mote (Anna P.) Elementary School
(Math: 6-9% | Reading: 20-24%)
Rank:
Rank:
2/
Bottom 50%10
2110 Edwards Avenue
Wilmington, DE 19808
(302) 992-5565
Wilmington, DE 19808
(302) 992-5565
Grades: K-5
| 324 students
Rank: #2121.
Richardson Park Elementary School
(Math: 11% | Reading: 15%)
Rank:
Rank:
1/
Bottom 50%10
16 Idella Avenue
Wilmington, DE 19804
(302) 992-5570
Wilmington, DE 19804
(302) 992-5570
Grades: K-5
| 509 students
Rank: #2222.
Stanton Middle School
(Math: 8% | Reading: 17%)
Rank:
Rank:
1/
Bottom 50%10
1800 Limestone Road
Wilmington, DE 19804
(302) 992-5540
Wilmington, DE 19804
(302) 992-5540
Grades: 6-8
| 619 students
Rank: #2323.
Johnson (Joseph E. Jr) Elementary School
(Math: 6-9% | Reading: 15-19%)
Rank:
Rank:
1/
Bottom 50%10
2100 Gilpin Avenue
Wilmington, DE 19806
(302) 651-2715
Wilmington, DE 19806
(302) 651-2715
Grades: K-5
| 303 students
Rank: #24 - 2524. - 25.
Dupont (Alexis I.) Middle School
(Math: 7% | Reading: 21%)
Rank:
Rank:
1/
Bottom 50%10
3130 Kennett Pike
Wilmington, DE 19807
(302) 651-2690
Wilmington, DE 19807
(302) 651-2690
Grades: 6-8
| 467 students
Rank: #24 - 2524. - 25.
Meadowood Program
Alternative School
(Math: ≤10% | Reading: 11-19%)
Rank:
Rank:
1/
Bottom 50%10
55a South Meadowood Drive
Newark, DE 19711
(302) 454-3400
Newark, DE 19711
(302) 454-3400
Grades: K-12
| 120 students
Rank: #2626.
Mckean (Thomas) High School
(Math: ≤5% | Reading: 15-19%)
Rank:
Rank:
1/
Bottom 50%10
301 Mckennan's Church Road
Wilmington, DE 19808
(302) 992-5520
Wilmington, DE 19808
(302) 992-5520
Grades: 9-12
| 870 students
Rank: #2727.
Warner Elementary School
(Math: 6% | Reading: 10%)
Rank:
Rank:
1/
Bottom 50%10
801 West 18th Street
Wilmington, DE 19802
(302) 651-2740
Wilmington, DE 19802
(302) 651-2740
Grades: 3-5
| 374 students
Rank: n/an/a
Red Clay Early Years Program
Alternative School
1621 Telegraph Road
Wilmington, DE 19804
(302) 651-2709
Wilmington, DE 19804
(302) 651-2709
Grades: PK
| 289 students
Frequently Asked Questions
How many schools belong to Red Clay Consolidated School District?
Red Clay Consolidated School District manages 28 public schools serving 14,546 students.
What is the rank of Red Clay Consolidated School District?
Red Clay Consolidated School District is ranked #14 out of 42 school districts in Delaware (top 50%) based off of combined math and reading proficiency testing data for the 2021-2022 school year. This district ranks in the top 20% of Delaware school districts for: Most diverse schools (Top 1%) and Largest student body (number of students) (Top 1%)
What is the racial composition of students in Red Clay Consolidated School District?
37% of Red Clay Consolidated School District students are White, 30% of students are Hispanic, 24% of students are Black, 5% of students are Asian, and 4% of students are Two or more races.
What is the student/teacher ratio of Red Clay Consolidated School District?
Red Clay Consolidated School District has a student/teacher ratio of 14:1, which is equal to the Delaware state average of 14:1.
What is Red Clay Consolidated School District's spending/student ratio?
The school district's spending/student of $20,964 is higher than the state median of $18,401. The school district spending/student has stayed relatively flat over four school years.
Recent Articles

What Is A Charter School?
Explore the world of charter schools in this comprehensive guide. Learn about their history, how they operate, and the pros and cons of this educational innovation. Discover key facts about charter schools, including admission policies, demographics, and funding, as well as what to look for when considering a charter school for your child.

10 Reasons Why High School Sports Benefit Students
Discover the 10 compelling reasons why high school sports are beneficial for students. This comprehensive article explores how athletics enhance academic performance, foster personal growth, and develop crucial life skills. From improved fitness and time management to leadership development and community representation, learn why participating in high school sports can be a game-changer for students' overall success and well-being.

February 05, 2025
Understanding the U.S. Department of Education: Structure, Impact, and EvolutionWe explore how the Department of Education shapes American education, from its cabinet-level leadership to its impact on millions of students, written for general audiences seeking clarity on this vital institution.


