Top Rankings
Bibb County School District ranks among the top 20% of public school district in Georgia for:
Category
Attribute
Community Size
Largest student body (number of students) (Top 1%)
For the 2025 school year, there are 35 public schools serving 21,324 students in Bibb County School District. This district's average testing ranking is 2/10, which is in the bottom 50% of public schools in Georgia.
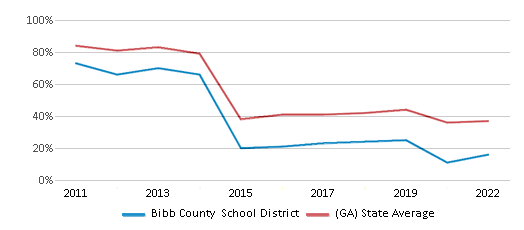
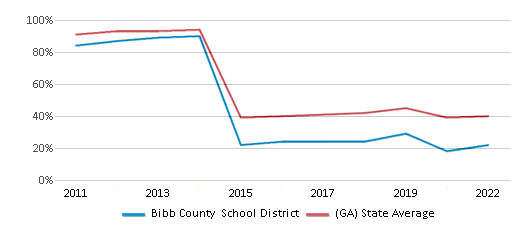
Public Schools in Bibb County School District have an average math proficiency score of 16% (versus the Georgia public school average of 38%), and reading proficiency score of 22% (versus the 40% statewide average).
Minority enrollment is 90% of the student body (majority Black), which is more than the Georgia public school average of 65% (majority Black).
Overview
This School District
This State (GA)
# Schools
35 Schools
2,330 Schools
# Students
21,324 Students
1,747,653 Students
# Teachers
1,427 Teachers
121,051 Teachers
Student : Teacher Ratio
15:1
15:1
District Rank
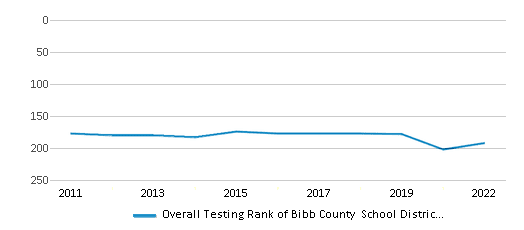
Bibb County School District, which is ranked within the bottom 50% of all 222 school districts in Georgia (based off of combined math and reading proficiency testing data) for the 2021-2022 school year.
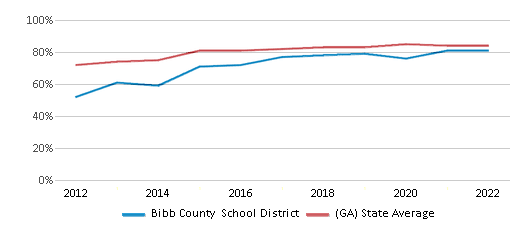
The school district's graduation rate of 81% has increased from 77% over five school years.
Overall District Rank
#192 out of 222 school districts
(Bottom 50%)
(Bottom 50%)
Math Test Scores (% Proficient)
16%
37%
Reading/Language Arts Test Scores (% Proficient)
22%
40%
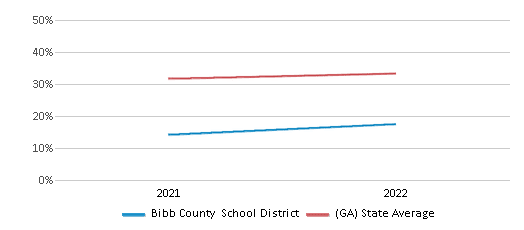
Science Test Scores (% Proficient)
21%
40%
Graduation Rate
81%
84%
Students by Ethnicity:
Diversity Score
0.39
0.71
# American Indian Students
37 Students
3,918 Students
% American Indian Students
n/a
n/a
# Asian Students
285 Students
85,795 Students
% Asian Students
1%
5%
# Hispanic Students
1,663 Students
327,122 Students
% Hispanic Students
8%
19%
# Black Students
16,400 Students
632,133 Students
% Black Students
77%
36%
# White Students
2,172 Students
612,293 Students
% White Students
10%
35%
# Hawaiian Students
7 Students
1,734 Students
% Hawaiian Students
n/a
n/a
# Two or more races Students
760 Students
84,151 Students
% of Two or more races Students
4%
5%
Students by Grade:
# Students in PK Grade:
862
50,489
# Students in K Grade:
1,570
118,882
# Students in 1st Grade:
1,705
124,992
# Students in 2nd Grade:
1,656
128,523
# Students in 3rd Grade:
1,634
125,808
# Students in 4th Grade:
1,664
127,364
# Students in 5th Grade:
1,575
128,693
# Students in 6th Grade:
1,649
129,323
# Students in 7th Grade:
1,615
131,446
# Students in 8th Grade:
1,534
133,602
# Students in 9th Grade:
1,901
153,942
# Students in 10th Grade:
1,582
144,127
# Students in 11th Grade:
1,305
131,171
# Students in 12th Grade:
1,072
119,291
# Ungraded Students:
-
-
District Revenue and Spending
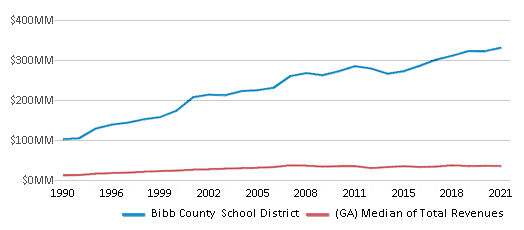
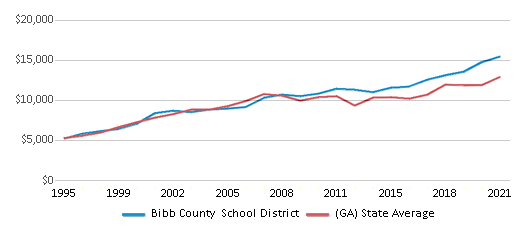
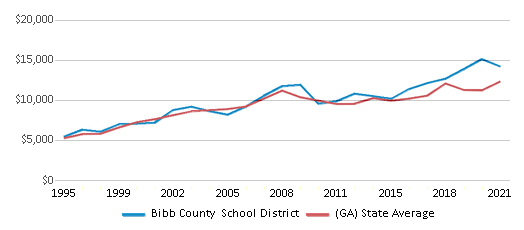
The revenue/student of $15,500 is higher than the state median of $14,305. The school district revenue/student has stayed relatively flat over four school years.
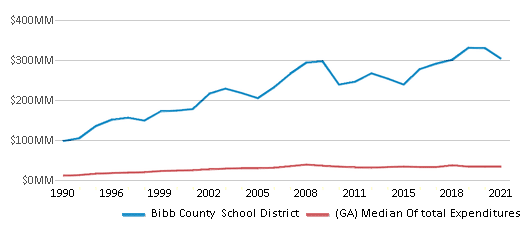
The school district's spending/student of $14,246 is higher than the state median of $13,431. The school district spending/student has stayed relatively flat over four school years.
Total Revenue
$331 MM
$24,999 MM
Spending
$304 MM
$23,473 MM
Revenue / Student
$15,500
$14,305
Spending / Student
$14,246
$13,431
Best Bibb County School District Public Schools (2025)
School
(Math and Reading Proficiency)
(Math and Reading Proficiency)
Location
Grades
Students
Rank: #11.
Alexander Ii Magnet School
Magnet School
(Math: 67% | Reading: 59%)
Rank:
Rank:
10/
Top 10%10
1156 College St
Macon, GA 31201
(478) 779-2679
Macon, GA 31201
(478) 779-2679
Grades: PK-5
| 479 students
Rank: #22.
Price Academy
(Math: <50% | Reading: <50%)
Rank:
Rank:
8/
Top 30%10
304 Pierce Ave
Macon, GA 31204
(478) 751-2800
Macon, GA 31204
(478) 751-2800
Grades: 3-12
| 15 students
Rank: #33.
Skyview Elementary School
(Math: 50-54% | Reading: 40-44%)
Rank:
Rank:
8/
Top 30%10
5700 Fulton Mill Rd
Lizella, GA 31052
(478) 779-3956
Lizella, GA 31052
(478) 779-3956
Grades: PK-5
| 435 students
Rank: #44.
Carter Elementary School
(Math: 50% | Reading: 44%)
Rank:
Rank:
8/
Top 30%10
5910 Zebulon Rd
Macon, GA 31210
(478) 779-3350
Macon, GA 31210
(478) 779-3350
Grades: PK-5
| 507 students
Rank: #55.
Springdale Elementary School
(Math: 46% | Reading: 41%)
Rank:
Rank:
7/
Top 50%10
4965 Northside Dr
Macon, GA 31210
(478) 779-3750
Macon, GA 31210
(478) 779-3750
Grades: PK-5
| 546 students
Rank: #66.
Vineville Academy
(Math: 30% | Reading: 36%)
Rank:
Rank:
5/
Bottom 50%10
2260 Vineville Ave
Macon, GA 31204
(478) 779-3226
Macon, GA 31204
(478) 779-3226
Grades: PK-5
| 475 students
Rank: #77.
Miller Magnet Middle School
Magnet School
(Math: 24% | Reading: 38%)
Rank:
Rank:
5/
Bottom 50%10
751 Hendley St
Macon, GA 31204
(478) 779-4029
Macon, GA 31204
(478) 779-4029
Grades: 6-8
| 582 students
Rank: #88.
Heard Elementary School
(Math: 30% | Reading: 33%)
Rank:
Rank:
5/
Bottom 50%10
6515 Houston Rd
Macon, GA 31216
(478) 779-4250
Macon, GA 31216
(478) 779-4250
Grades: PK-5
| 571 students
Rank: #99.
Heritage Elementary School
(Math: 28% | Reading: 29%)
Rank:
Rank:
4/
Bottom 50%10
6050 Thomaston Rd
Macon, GA 31220
(478) 779-4715
Macon, GA 31220
(478) 779-4715
Grades: PK-5
| 525 students
Rank: #1010.
Howard Middle School
(Math: 19% | Reading: 31%)
Rank:
Rank:
4/
Bottom 50%10
6600 Forsyth Rd
Macon, GA 31210
(478) 779-3454
Macon, GA 31210
(478) 779-3454
Grades: 6-8
| 989 students
Rank: #1111.
Rutland Middle School
(Math: 18% | Reading: 27%)
Rank:
Rank:
3/
Bottom 50%10
6260 Skipper Rd
Macon, GA 31216
(478) 779-4369
Macon, GA 31216
(478) 779-4369
Grades: 6-8
| 871 students
Rank: #1212.
Porter Elementary School
(Math: 20-24% | Reading: 20-24%)
Rank:
Rank:
3/
Bottom 50%10
5802 School Rd
Macon, GA 31216
(478) 779-4350
Macon, GA 31216
(478) 779-4350
Grades: PK-5
| 429 students
Rank: #1313.
Burdell Elementary School
(Math: 18% | Reading: 22%)
Rank:
Rank:
3/
Bottom 50%10
972 Fort Hill St
Macon, GA 31217
(478) 779-2937
Macon, GA 31217
(478) 779-2937
Grades: PK-5
| 431 students
Rank: #1414.
Rutland High School
(Math: 14% | Reading: 25%)
Rank:
Rank:
3/
Bottom 50%10
6250 Skipper Rd
Macon, GA 31216
(478) 779-3041
Macon, GA 31216
(478) 779-3041
Grades: 9-12
| 897 students
Rank: #1515.
Central High School
(Math: 9% | Reading: 29%)
Rank:
Rank:
3/
Bottom 50%10
2155 Napier Ave
Macon, GA 31204
(478) 779-2292
Macon, GA 31204
(478) 779-2292
Grades: 9-12
| 876 students
Rank: #1616.
Rosa Taylor Elementary School
(Math: 17% | Reading: 21%)
Rank:
Rank:
2/
Bottom 50%10
2976 Crestline Dr
Macon, GA 31204
(478) 779-3563
Macon, GA 31204
(478) 779-3563
Grades: PK-5
| 578 students
Rank: #1717.
Lane Elementary School
(Math: 18% | Reading: 20%)
Rank:
Rank:
2/
Bottom 50%10
990 Newport Rd
Macon, GA 31210
(478) 779-3150
Macon, GA 31210
(478) 779-3150
Grades: PK-5
| 441 students
Rank: #1818.
Howard High School
(Math: 10% | Reading: 25%)
Rank:
Rank:
2/
Bottom 50%10
6400 Forsyth Rd
Macon, GA 31210
(478) 779-7852
Macon, GA 31210
(478) 779-7852
Grades: 9-12
| 1,133 students
Rank: #1919.
Bernd Elementary School
(Math: 15-19% | Reading: 10-14%)
Rank:
Rank:
2/
Bottom 50%10
4160 Ocmulgee East Blvd
Macon, GA 31217
(478) 779-2730
Macon, GA 31217
(478) 779-2730
Grades: PK-5
| 408 students
Rank: #2020.
Vip Academy (Virtual)
(Math: 5% | Reading: 22%)
Rank:
Rank:
2/
Bottom 50%10
2011 Riverside Drive
Macon, GA 31204
(478) 779-4872
Macon, GA 31204
(478) 779-4872
Grades: 4-12
| 476 students
Rank: #2121.
Appling Middle School
(Math: 10% | Reading: 16%)
Rank:
Rank:
1/
Bottom 50%10
1646b Upper River Rd
Macon, GA 31211
(478) 779-2200
Macon, GA 31211
(478) 779-2200
Grades: 6-8
| 676 students
Rank: #2222.
Hartley Elementary School
(Math: 10-14% | Reading: 10-14%)
Rank:
Rank:
1/
Bottom 50%10
2230 Anthony Rd
Macon, GA 31204
(478) 779-2500
Macon, GA 31204
(478) 779-2500
Grades: PK-5
| 391 students
Rank: #2323.
John Robert Lewis Elementary School
(Math: 10% | Reading: 15%)
Rank:
Rank:
1/
Bottom 50%10
3522 Greenbriar Road
Macon, GA 31204
(478) 779-2050
Macon, GA 31204
(478) 779-2050
Grades: PK-5
| 724 students
Rank: #2424.
Veterans Elementary School
(Math: 11% | Reading: 14%)
Rank:
Rank:
1/
Bottom 50%10
4901 Faubus Ave
Macon, GA 31204
(478) 779-4800
Macon, GA 31204
(478) 779-4800
Grades: PK-5
| 708 students
Rank: #2525.
Martin Luther King Jr Elementary School
(Math: 10% | Reading: 13%)
Rank:
Rank:
1/
Bottom 50%10
1307 Shurling Dr
Macon, GA 31211
(478) 779-2100
Macon, GA 31211
(478) 779-2100
Grades: PK-5
| 639 students
Rank: #2626.
Bruce Elementary School
(Math: 10-14% | Reading: 6-9%)
Rank:
Rank:
1/
Bottom 50%10
3660 Houston Ave
Macon, GA 31206
(478) 779-4558
Macon, GA 31206
(478) 779-4558
Grades: PK-5
| 417 students
Rank: #2727.
Union Elementary School
(Math: 6-9% | Reading: 10-14%)
Rank:
Rank:
1/
Bottom 50%10
4831 Mamie Carter Dr
Macon, GA 31210
(478) 773-2629
Macon, GA 31210
(478) 773-2629
Grades: PK-5
| 469 students
Rank: #2828.
Weaver Middle School
(Math: 6% | Reading: 14%)
Rank:
Rank:
1/
Bottom 50%10
2570 Heath Rd
Macon, GA 31206
(478) 779-4630
Macon, GA 31206
(478) 779-4630
Grades: 6-8
| 895 students
Rank: #2929.
Westside High School
(Math: 4% | Reading: 14%)
Rank:
Rank:
1/
Bottom 50%10
2851 Heath Rd
Macon, GA 31206
(478) 779-3800
Macon, GA 31206
(478) 779-3800
Grades: 9-12
| 1,010 students
Rank: #3030.
Northeast High School
(Math: ≤5% | Reading: 10-14%)
Rank:
Rank:
1/
Bottom 50%10
1646 Upper River Rd
Macon, GA 31211
(478) 779-4157
Macon, GA 31211
(478) 779-4157
Grades: 9-12
| 790 students
Rank: #3131.
Ingram/pye Elementary School
(Math: 6-9% | Reading: 6-9%)
Rank:
Rank:
1/
Bottom 50%10
855 Anthony Rd
Macon, GA 31204
(478) 779-3000
Macon, GA 31204
(478) 779-3000
Grades: PK-5
| 455 students
Rank: #3232.
Ballard Hudson Middle School
(Math: 5% | Reading: 10%)
Rank:
Rank:
1/
Bottom 50%10
1070 Anthony Rd
Macon, GA 31204
(478) 779-3390
Macon, GA 31204
(478) 779-3390
Grades: 6-8
| 644 students
Rank: #3333.
Williams Elementary School
(Math: 6-9% | Reading: ≤5%)
Rank:
Rank:
1/
Bottom 50%10
325 Pursley St
Macon, GA 31201
(478) 779-3660
Macon, GA 31201
(478) 779-3660
Grades: PK-5
| 334 students
Rank: #3434.
Southfield Elementary School
(Math: 5% | Reading: 9%)
Rank:
Rank:
1/
Bottom 50%10
4375 Bloomfield Drive Ext
Macon, GA 31206
(478) 779-4800
Macon, GA 31206
(478) 779-4800
Grades: PK-5
| 688 students
Rank: #3535.
Southwest High School
(Math: 3% | Reading: 6-9%)
Rank:
Rank:
1/
Bottom 50%10
1775 Williamson Rd
Macon, GA 31206
(478) 779-4459
Macon, GA 31206
(478) 779-4459
Grades: 9-12
| 820 students
Frequently Asked Questions
How many schools belong to Bibb County School District?
Bibb County School District manages 35 public schools serving 21,324 students.
What is the rank of Bibb County School District?
Bibb County School District is ranked #191 out of 222 school districts in Georgia (bottom 50%) based off of combined math and reading proficiency testing data for the 2021-2022 school year. This district ranks in the top 20% of Georgia school districts for: Largest student body (number of students) (Top 1%)
What is the racial composition of students in Bibb County School District?
77% of Bibb County School District students are Black, 10% of students are White, 8% of students are Hispanic, 4% of students are Two or more races, and 1% of students are Asian.
What is the student/teacher ratio of Bibb County School District?
Bibb County School District has a student/teacher ratio of 15:1, which is higher than the Georgia state average of 14:1.
What is Bibb County School District's spending/student ratio?
The school district's spending/student of $14,246 is higher than the state median of $13,431. The school district spending/student has stayed relatively flat over four school years.
Recent Articles

Sexual Harassment at Age 6: The Tale of a First Grade Suspension
A six-year old in Aurora, Colorado, was suspended after singing an LMFAO song to a little girl in his class and reportedly “shaking his booty.” We look at the case and the sexual harassment problem in public schools today.

How Scaffolding Could Change the Way Your Child Learns
This article explores the concept of instructional scaffolding, a teaching method that enhances learning by breaking down complex tasks into manageable parts. It highlights how scaffolding supports students in developing critical thinking skills and becoming more independent learners. The article discusses the benefits of scaffolding, including improved engagement and reduced anxiety, and provides strategies for its implementation across various educational levels.

February 05, 2025
Understanding the U.S. Department of Education: Structure, Impact, and EvolutionWe explore how the Department of Education shapes American education, from its cabinet-level leadership to its impact on millions of students, written for general audiences seeking clarity on this vital institution.


