Top Rankings
Savannah-Chatham County School District ranks among the top 20% of public school district in Georgia for:
Category
Attribute
Community Size
Largest student body (number of students) (Top 1%)
Student Attention
Lowest student:teacher ratio (Top 1%)
For the 2025 school year, there are 57 public schools serving 34,928 students in Savannah-Chatham County School District. This district's average testing ranking is 3/10, which is in the bottom 50% of public schools in Georgia.
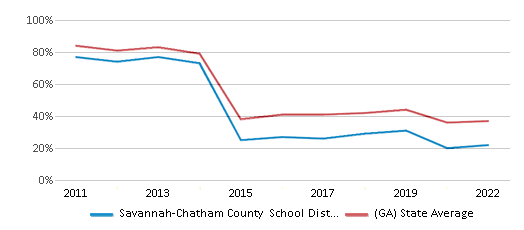
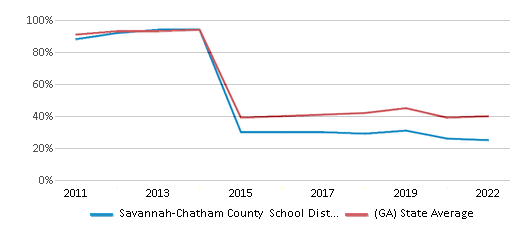
Public Schools in Savannah-Chatham County School District have an average math proficiency score of 22% (versus the Georgia public school average of 38%), and reading proficiency score of 25% (versus the 40% statewide average).
Minority enrollment is 81% of the student body (majority Black), which is more than the Georgia public school average of 65% (majority Black).
Overview
This School District
This State (GA)
# Schools
57 Schools
2,330 Schools
# Students
34,928 Students
1,747,653 Students
# Teachers
2,603 Teachers
121,051 Teachers
Student : Teacher Ratio
13:1
13:1
District Rank
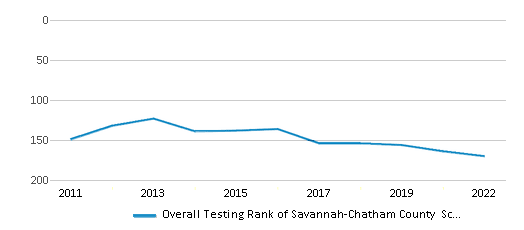
Savannah-Chatham County School District, which is ranked within the bottom 50% of all 222 school districts in Georgia (based off of combined math and reading proficiency testing data) for the 2021-2022 school year.
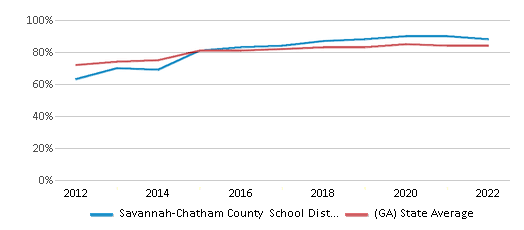
The school district's graduation rate of 88% has increased from 84% over five school years.
Overall District Rank
#170 out of 222 school districts
(Bottom 50%)
(Bottom 50%)
Math Test Scores (% Proficient)
22%
37%
Reading/Language Arts Test Scores (% Proficient)
25%
40%
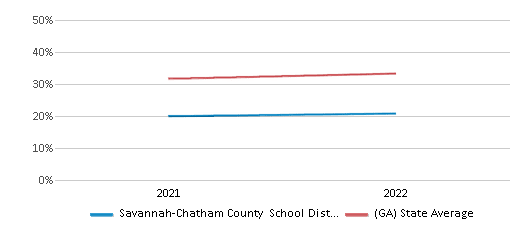
Science Test Scores (% Proficient)
25%
40%
Graduation Rate
88%
84%
Students by Ethnicity:
Diversity Score
0.61
0.71
# American Indian Students
77 Students
3,918 Students
% American Indian Students
n/a
n/a
# Asian Students
818 Students
85,795 Students
% Asian Students
2%
5%
# Hispanic Students
5,441 Students
327,122 Students
% Hispanic Students
16%
19%
# Black Students
20,037 Students
632,133 Students
% Black Students
57%
36%
# White Students
6,479 Students
612,293 Students
% White Students
19%
35%
# Hawaiian Students
90 Students
1,734 Students
% Hawaiian Students
n/a
n/a
# Two or more races Students
1,986 Students
84,151 Students
% of Two or more races Students
6%
5%
Students by Grade:
# Students in PK Grade:
1,622
50,489
# Students in K Grade:
2,594
118,882
# Students in 1st Grade:
2,730
124,992
# Students in 2nd Grade:
2,929
128,523
# Students in 3rd Grade:
2,642
125,808
# Students in 4th Grade:
2,774
127,364
# Students in 5th Grade:
2,723
128,693
# Students in 6th Grade:
2,627
129,323
# Students in 7th Grade:
2,588
131,446
# Students in 8th Grade:
2,611
133,602
# Students in 9th Grade:
3,281
153,942
# Students in 10th Grade:
2,377
144,127
# Students in 11th Grade:
1,920
131,171
# Students in 12th Grade:
1,510
119,291
# Ungraded Students:
-
-
District Revenue and Spending
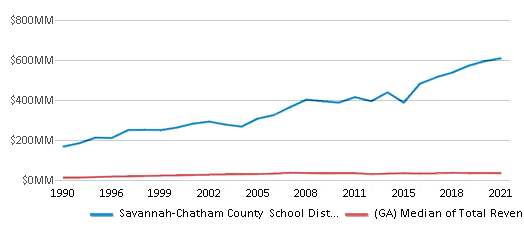
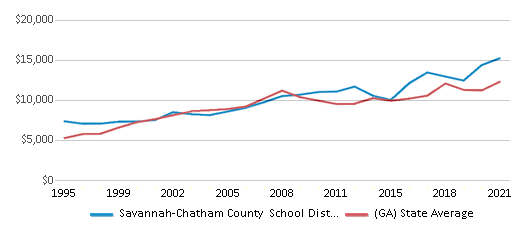
The revenue/student of $17,433 is higher than the state median of $14,305. The school district revenue/student has stayed relatively flat over four school years.
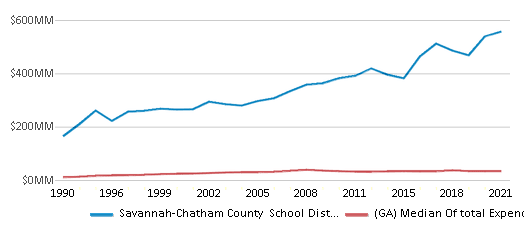
The school district's spending/student of $15,933 is higher than the state median of $13,431. The school district spending/student has stayed relatively flat over four school years.
Total Revenue
$609 MM
$24,999 MM
Spending
$557 MM
$23,473 MM
Revenue / Student
$17,433
$14,305
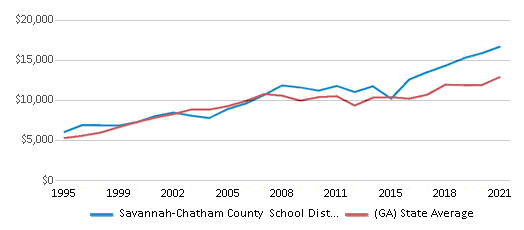
Spending / Student
$15,933
$13,431
Best Savannah-Chatham County School District Public Schools (2025)
School
(Math and Reading Proficiency)
(Math and Reading Proficiency)
Location
Grades
Students
Rank: #11.
May Howard Elementary School
(Math: 64% | Reading: 58%)
Rank:
Rank:
9/
Top 20%10
115 Wilmington Island Rd
Savannah, GA 31410
(912) 395-3925
Savannah, GA 31410
(912) 395-3925
Grades: PK-5
| 565 students
Rank: #22.
Jacob G. Smith Elementary School
(Math: 55-59% | Reading: 55-59%)
Rank:
Rank:
9/
Top 20%10
210 Lamara Dr
Savannah, GA 31405
(912) 395-6530
Savannah, GA 31405
(912) 395-6530
Grades: PK-5
| 468 students
Rank: #33.
Esther F. Garrison School For The Arts
(Math: 50% | Reading: 62%)
Rank:
Rank:
9/
Top 20%10
649 W Jones St
Savannah, GA 31401
(912) 395-5975
Savannah, GA 31401
(912) 395-5975
Grades: PK-8
| 776 students
Rank: #44.
The Stem Academy At Bartlett
(Math: 49% | Reading: 61%)
Rank:
Rank:
9/
Top 20%10
207 Montgomery Xrd
Savannah, GA 31406
(912) 395-3500
Savannah, GA 31406
(912) 395-3500
Grades: 6-8
| 697 students
Rank: #55.
Woodville-tompkins Technical And Career High School
(Math: 45-49% | Reading: 50-54%)
Rank:
Rank:
8/
Top 30%10
151 Coach Joe Turner St
Savannah, GA 31408
(912) 395-6750
Savannah, GA 31408
(912) 395-6750
Grades: 9-12
| 706 students
Rank: #66.
Marshpoint Elementary School
(Math: 46% | Reading: 44%)
Rank:
Rank:
7/
Top 50%10
135 Whitemarsh Island Rd
Savannah, GA 31410
(912) 395-4000
Savannah, GA 31410
(912) 395-4000
Grades: PK-5
| 645 students
Rank: #77.
Tybee Island Maritime Academy School
Charter School
(Math: 42% | Reading: 43%)
Rank:
Rank:
7/
Top 50%10
714 Lovell Ave
Tybee Island, GA 31328
(912) 395-4060
Tybee Island, GA 31328
(912) 395-4060
Grades: K-8
| 428 students
Rank: #88.
Savannah Classical Academy Charter School
Charter School
(Math: 40-44% | Reading: 40-44%)
Rank:
Rank:
7/
Top 50%10
705 E Anderson St
Savannah, GA 31401
(912) 395-4040
Savannah, GA 31401
(912) 395-4040
Grades: K-8
| 365 students
Rank: #99.
Savannah Classical Academy Charter High School
Charter School
(Math: 30-39% | Reading: <50%)
Rank:
Rank:
7/
Top 50%10
705 E Anderson St # 31401
Savannah, GA 31401
(912) 395-4040
Savannah, GA 31401
(912) 395-4040
Grades: 9-12
| 84 students
Rank: #1010.
Savannah Early College High School
(Math: 21-39% | Reading: 50-59%)
Rank:
Rank:
7/
Top 50%10
400 Pennsylvania Ave
Savannah, GA 31404
(912) 395-2535
Savannah, GA 31404
(912) 395-2535
Grades: 9-12
| 145 students
Rank: #1111.
Coastal Middle School
(Math: 40% | Reading: 38%)
Rank:
Rank:
6/
Top 50%10
4595 Us Highway 80 E
Savannah, GA 31410
(912) 395-3950
Savannah, GA 31410
(912) 395-3950
Grades: 6-8
| 512 students
Rank: #1212.
Ellis Elementary School
(Math: 27% | Reading: 42%)
Rank:
Rank:
6/
Top 50%10
220 E 49th St
Savannah, GA 31405
(912) 395-5470
Savannah, GA 31405
(912) 395-5470
Grades: PK-8
| 428 students
Rank: #1313.
Islands High School
(Math: 15-19% | Reading: 51%)
Rank:
Rank:
6/
Top 50%10
170 Whitemarsh Island Rd
Savannah, GA 31410
(912) 395-2000
Savannah, GA 31410
(912) 395-2000
Grades: 9-12
| 814 students
Rank: #1414.
Pooler Elementary School
(Math: 34% | Reading: 30-34%)
Rank:
Rank:
5/
Bottom 50%10
308 Holly Ave
Pooler, GA 31322
(912) 395-3625
Pooler, GA 31322
(912) 395-3625
Grades: PK-5
| 357 students
Rank: #1515.
Pulaski Elementary School
(Math: 39% | Reading: 29%)
Rank:
Rank:
5/
Bottom 50%10
1001 Tibet Ave
Savannah, GA 31419
(912) 395-6466
Savannah, GA 31419
(912) 395-6466
Grades: PK-5
| 576 students
Rank: #1616.
Heard Elementary School
(Math: 32% | Reading: 32%)
Rank:
Rank:
5/
Bottom 50%10
414 Lee Blvd
Savannah, GA 31405
(912) 395-6630
Savannah, GA 31405
(912) 395-6630
Grades: PK-5
| 664 students
Rank: #1717.
New Hampstead High School
(Math: 34% | Reading: 31%)
Rank:
Rank:
5/
Bottom 50%10
2451 Little Neck Rd
Bloomingdale, GA 31302
(912) 395-6789
Bloomingdale, GA 31302
(912) 395-6789
Grades: 9-12
| 1,487 students
Rank: #1818.
Godley Station School
(Math: 29% | Reading: 33%)
Rank:
Rank:
5/
Bottom 50%10
2135 Benton Blvd
Port Wentworth, GA 31407
(912) 395-6000
Port Wentworth, GA 31407
(912) 395-6000
Grades: PK-8
| 1,133 students
Rank: #1919.
New Hampstead K-8 School
(Math: 27% | Reading: 29%)
Rank:
Rank:
4/
Bottom 50%10
1700 Highgate Blvd
Bloomingdale, GA 31302
(912) 395-6200
Bloomingdale, GA 31302
(912) 395-6200
Grades: PK-8
| 848 students
Rank: #20 - 2120. - 21.
Bloomingdale Elementary School
(Math: 25-29% | Reading: 25-29%)
Rank:
Rank:
4/
Bottom 50%10
1700 Highgate Blvd
Bloomingdale, GA 31302
(912) 395-3680
Bloomingdale, GA 31302
(912) 395-3680
Grades: PK-5
| 331 students
Rank: #20 - 2120. - 21.
Garden City Elementary School
(Math: 30-34% | Reading: 20-24%)
Rank:
Rank:
4/
Bottom 50%10
4037 Kessler Ave
Savannah, GA 31408
(912) 395-6820
Savannah, GA 31408
(912) 395-6820
Grades: PK-5
| 580 students
Rank: #2222.
Hesse School
(Math: 29% | Reading: 26%)
Rank:
Rank:
4/
Bottom 50%10
9116 Whitefield Ave
Savannah, GA 31406
(912) 395-6440
Savannah, GA 31406
(912) 395-6440
Grades: PK-8
| 995 students
Rank: #2323.
Jenkins High School
(Math: 22% | Reading: 28%)
Rank:
Rank:
4/
Bottom 50%10
1800 E De Renne Ave
Savannah, GA 31406
(912) 395-6300
Savannah, GA 31406
(912) 395-6300
Grades: 9-12
| 1,179 students
Rank: #24 - 2524. - 25.
Susie King Taylor Community School
Charter School
(Math: 20-24% | Reading: 25-29%)
Rank:
Rank:
4/
Bottom 50%10
1709 Bull St
Savannah, GA 31401
(912) 395-4200
Savannah, GA 31401
(912) 395-4200
Grades: K-8
| 309 students
Rank: #24 - 2524. - 25.
Windsor Forest Elementary School
(Math: 20-24% | Reading: 25-29%)
Rank:
Rank:
4/
Bottom 50%10
414 Briarcliff Cir
Savannah, GA 31419
(912) 395-3353
Savannah, GA 31419
(912) 395-3353
Grades: PK-5
| 451 students
Rank: #2626.
Southwest Elementary School
(Math: 29% | Reading: 20%)
Rank:
Rank:
3/
Bottom 50%10
6020 Ogeechee Rd
Savannah, GA 31419
(912) 395-3300
Savannah, GA 31419
(912) 395-3300
Grades: PK-5
| 729 students
Rank: #2727.
West Chatham Elementary School
(Math: 26% | Reading: 22%)
Rank:
Rank:
3/
Bottom 50%10
820 Pine Barren Rd
Pooler, GA 31322
(912) 395-3600
Pooler, GA 31322
(912) 395-3600
Grades: PK-5
| 809 students
Rank: #2828.
Johnson High School
(Math: 15-19% | Reading: 25-29%)
Rank:
Rank:
3/
Bottom 50%10
3012 Sunset Blvd
Savannah, GA 31404
(912) 395-6400
Savannah, GA 31404
(912) 395-6400
Grades: 9-12
| 797 students
Rank: #2929.
Georgetown School
(Math: 19% | Reading: 25%)
Rank:
Rank:
3/
Bottom 50%10
1516 King George Blvd
Savannah, GA 31419
(912) 395-3475
Savannah, GA 31419
(912) 395-3475
Grades: PK-8
| 525 students
Rank: #3030.
Hodge Elementary School
(Math: 20-24% | Reading: 15-19%)
Rank:
Rank:
3/
Bottom 50%10
975 Clinch Street
Savannah, GA 31405
(912) 395-5200
Savannah, GA 31405
(912) 395-5200
Grades: PK-5
| 388 students
Rank: #3131.
Uhs Of Savannah Coastal Harbor Treatment Center
(Math: ≤20% | Reading: ≤20%)
Rank:
Rank:
2/
Bottom 50%10
1150 Cornell Ave
Savannah, GA 31406
(912) 354-3911
Savannah, GA 31406
(912) 354-3911
Grades: PK-12
| 61 students
Rank: #3232.
Isle Of Hope School
(Math: 16% | Reading: 21%)
Rank:
Rank:
2/
Bottom 50%10
100 Parkersburg Rd
Savannah, GA 31406
(912) 395-6555
Savannah, GA 31406
(912) 395-6555
Grades: PK-8
| 613 students
Rank: #3333.
White Bluff Elementary School
(Math: 17% | Reading: 19%)
Rank:
Rank:
2/
Bottom 50%10
9402 White Bluff Road
Savannah, GA 31406
(912) 395-3325
Savannah, GA 31406
(912) 395-3325
Grades: PK-5
| 660 students
Rank: #3434.
Coastal Empire Montessori Charter School
Charter School
(Math: 10-14% | Reading: 20-24%)
Rank:
Rank:
2/
Bottom 50%10
301 Buckhalter Rd
Savannah, GA 31405
(912) 395-4070
Savannah, GA 31405
(912) 395-4070
Grades: PK-5
| 218 students
Rank: #3535.
West Chatham Middle School
(Math: 17% | Reading: 18%)
Rank:
Rank:
2/
Bottom 50%10
800 Pine Barren Rd
Pooler, GA 31322
(912) 395-3650
Pooler, GA 31322
(912) 395-3650
Grades: 6-8
| 943 students
Show 22 more public schools in Savannah-Chatham County School District (out of 57 total schools)
Loading...
Frequently Asked Questions
How many schools belong to Savannah-Chatham County School District?
Savannah-Chatham County School District manages 57 public schools serving 34,928 students.
What is the rank of Savannah-Chatham County School District?
Savannah-Chatham County School District is ranked #170 out of 222 school districts in Georgia (bottom 50%) based off of combined math and reading proficiency testing data for the 2021-2022 school year. This district ranks in the top 20% of Georgia school districts for: Largest student body (number of students) (Top 1%) and Lowest student:teacher ratio (Top 1%)
What is the racial composition of students in Savannah-Chatham County School District?
57% of Savannah-Chatham County School District students are Black, 19% of students are White, 16% of students are Hispanic, 6% of students are Two or more races, and 2% of students are Asian.
What is the student/teacher ratio of Savannah-Chatham County School District?
Savannah-Chatham County School District has a student/teacher ratio of 13:1, which is lower than the Georgia state average of 14:1.
What is Savannah-Chatham County School District's spending/student ratio?
The school district's spending/student of $15,933 is higher than the state median of $13,431. The school district spending/student has stayed relatively flat over four school years.
Recent Articles

What Is A Charter School?
Explore the world of charter schools in this comprehensive guide. Learn about their history, how they operate, and the pros and cons of this educational innovation. Discover key facts about charter schools, including admission policies, demographics, and funding, as well as what to look for when considering a charter school for your child.

10 Reasons Why High School Sports Benefit Students
Discover the 10 compelling reasons why high school sports are beneficial for students. This comprehensive article explores how athletics enhance academic performance, foster personal growth, and develop crucial life skills. From improved fitness and time management to leadership development and community representation, learn why participating in high school sports can be a game-changer for students' overall success and well-being.

February 05, 2025
Understanding the U.S. Department of Education: Structure, Impact, and EvolutionWe explore how the Department of Education shapes American education, from its cabinet-level leadership to its impact on millions of students, written for general audiences seeking clarity on this vital institution.


