Top Rankings
Indian Prairie CUSD 204 School District ranks among the top 20% of public school district in Illinois for:
Category
Attribute
Overall Rank
Highest overall rank (Top 10%)
Math Proficiency
Highest math proficiency (Top 10%)
Reading/Language Arts Proficiency
Highest reading/language arts proficiency (Top 20%)
Science Proficiency
Highest science proficiency (Top 10%)
Graduation Rate
Highest graduation rate (Top 10%)
Diversity
Most diverse schools (Top 1%)
Community Size
Largest student body (number of students) (Top 1%)
For the 2025 school year, there are 28 public elementary schools serving 16,772 students in Indian Prairie CUSD 204 School District. This district's average elementary testing ranking is 10/10, which is in the top 10% of public elementary schools in Illinois.
Public Elementary Schools in Indian Prairie CUSD 204 School District have an average math proficiency score of 45% (versus the Illinois public elementary school average of 26%), and reading proficiency score of 48% (versus the 30% statewide average).
The top ranked public elementary schools in Indian Prairie CUSD 204 School District are Oliver Julian Kendall Elementary School, V Blanche Graham Elementary School and Spring Brook Elementary School. Overall testing rank is based on a school's combined math and reading proficiency test score ranking. Minority enrollment is 69% of the student body (majority Asian), which is more than the Illinois public elementary school average of 56% (majority Hispanic).
Overview
This School District
This State (IL)
# Schools
34 Schools
3,104 Schools
# Students
25,950 Students
1,223,907 Students
# Teachers
1,795 Teachers
89,922 Teachers
Student : Teacher Ratio
15:1
15:1
District Rank
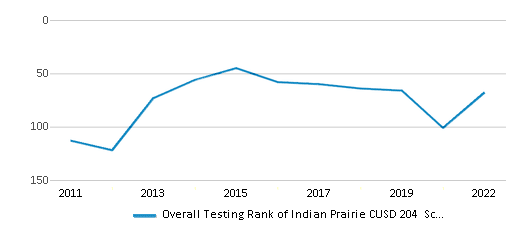
Indian Prairie CUSD 204 School District, which is ranked within the top 10% of all 844 school districts in Illinois (based off of combined math and reading proficiency testing data) for the 2020-2021 school year.
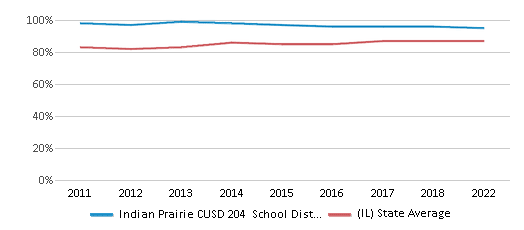
The school district's graduation rate of 95% has decreased from 98% over five school years.
Overall District Rank
#68 out of 852 school districts
(Top 10%)
(Top 10%)
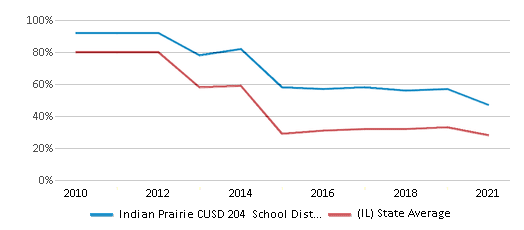
Math Test Scores (% Proficient)
(20-21)47%
28%
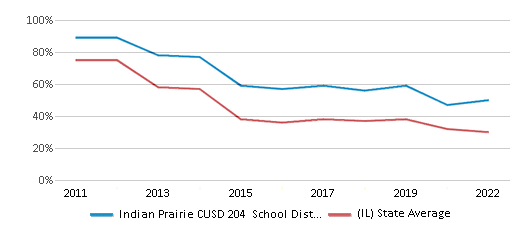
Reading/Language Arts Test Scores (% Proficient)
50%
30%
Science Test Scores (% Proficient)
75%
50%
Graduation Rate
95%
87%
Students by Ethnicity:
Diversity Score
0.72
0.71
# American Indian Students
95 Students
2,875 Students
% American Indian Students
n/a
1%
# Asian Students
10,175 Students
66,874 Students
% Asian Students
39%
6%
# Hispanic Students
3,406 Students
327,522 Students
% Hispanic Students
13%
27%
# Black Students
2,463 Students
200,526 Students
% Black Students
10%
17%
# White Students
8,455 Students
537,078 Students
% White Students
33%
44%
# Hawaiian Students
20 Students
1,010 Students
% Hawaiian Students
n/a
n/a
# Two or more races Students
1,333 Students
52,605 Students
% of Two or more races Students
5%
5%
Students by Grade:
# Students in PK Grade:
582
55,955
# Students in K Grade:
1,654
116,411
# Students in 1st Grade:
1,645
126,375
# Students in 2nd Grade:
1,802
167,370
# Students in 3rd Grade:
1,871
130,315
# Students in 4th Grade:
1,832
130,334
# Students in 5th Grade:
1,925
129,913
# Students in 6th Grade:
1,983
132,181
# Students in 7th Grade:
1,978
113,007
# Students in 8th Grade:
2,082
113,824
# Students in 9th Grade:
2,077
2,377
# Students in 10th Grade:
2,110
2,138
# Students in 11th Grade:
2,135
1,882
# Students in 12th Grade:
2,274
1,813
# Ungraded Students:
-
12
District Revenue and Spending
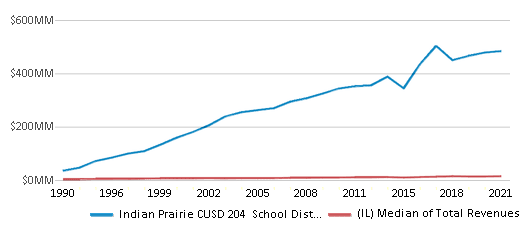
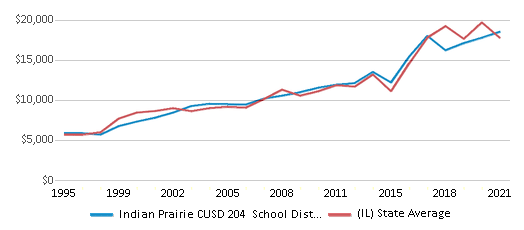
The revenue/student of $18,645 in this school district is less than the state median of $21,990. The school district revenue/student has stayed relatively flat over four school years.
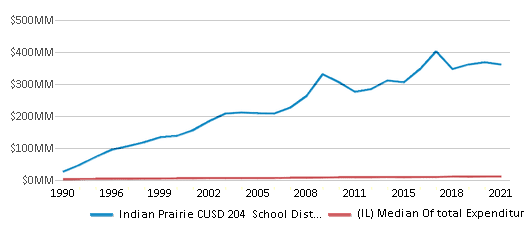
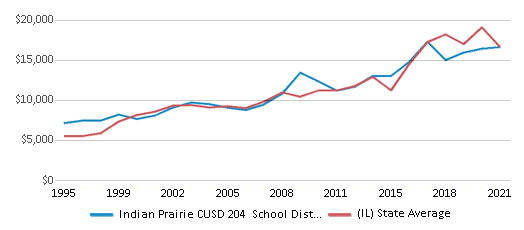
The school district's spending/student of $16,732 is less than the state median of $21,244. The school district spending/student has stayed relatively flat over four school years.
Total Revenue
$484 MM
$41,381 MM
Spending
$434 MM
$39,976 MM
Revenue / Student
$18,645
$21,990
Spending / Student
$16,732
$21,244
Best Indian Prairie CUSD 204 School District Public Elementary Schools (2025)
School
(Math and Reading Proficiency)
(Math and Reading Proficiency)
Location
Grades
Students
Rank: #11.
Oliver Julian Kendall Elementary School
Rank:
10/
Top 5%10
2408 Meadow Lake Dr
Naperville, IL 60564
(630) 428-7100
Naperville, IL 60564
(630) 428-7100
Grades: K-5
| 568 students
Rank: #22.
V Blanche Graham Elementary School
Rank:
10/
Top 5%10
2315 High Meadow Rd
Naperville, IL 60564
(630) 428-6900
Naperville, IL 60564
(630) 428-6900
Grades: K-5
| 310 students
Rank: #33.
Spring Brook Elementary School
Rank:
10/
Top 5%10
2700 Seiler Dr
Naperville, IL 60565
(630) 428-6600
Naperville, IL 60565
(630) 428-6600
Grades: K-5
| 561 students
Rank: #44.
Robert Clow Elementary School
Rank:
10/
Top 5%10
1301 Springdale Cir
Naperville, IL 60564
(630) 428-6060
Naperville, IL 60564
(630) 428-6060
Grades: K-5
| 328 students
Rank: #55.
Fry Elementary School
Rank:
10/
Top 5%10
3204 Tall Grass Dr
Naperville, IL 60564
(630) 428-7400
Naperville, IL 60564
(630) 428-7400
Grades: K-5
| 573 students
Rank: #66.
Danielle-joy Peterson Elementary School
Rank:
10/
Top 5%10
4008 Chinaberry Ln
Naperville, IL 60564
(630) 428-5678
Naperville, IL 60564
(630) 428-5678
Grades: K-5
| 563 students
Rank: #77.
Patterson Elementary School
Rank:
10/
Top 5%10
3731 Lawrence Dr
Naperville, IL 60564
(630) 428-6500
Naperville, IL 60564
(630) 428-6500
Grades: K-5
| 469 students
Rank: #88.
May Watts Elementary School
Rank:
10/
Top 5%10
800 S Whispering Hills Dr
Naperville, IL 60540
(630) 428-6700
Naperville, IL 60540
(630) 428-6700
Grades: K-5
| 620 students
Rank: #99.
Gordon Gregory Middle School
Rank:
10/
Top 10%10
2621 Springdale Cir
Naperville, IL 60564
(630) 428-6300
Naperville, IL 60564
(630) 428-6300
Grades: 6-8
| 838 students
Rank: #1010.
Scullen Middle School
Rank:
10/
Top 10%10
2815 Mistflower Ln
Naperville, IL 60564
(630) 428-7000
Naperville, IL 60564
(630) 428-7000
Grades: 6-8
| 937 students
Rank: #1111.
White Eagle Elementary School
Rank:
10/
Top 10%10
1585 White Eagle Dr
Naperville, IL 60564
(630) 375-3600
Naperville, IL 60564
(630) 375-3600
Grades: K-5
| 582 students
Rank: #1212.
Arlene Welch Elementary School
Rank:
10/
Top 10%10
2620 Leverenz Rd
Naperville, IL 60564
(630) 428-7200
Naperville, IL 60564
(630) 428-7200
Grades: K-5
| 588 students
Rank: #1313.
Gwendolyn Brooks Elementary School
Rank:
10/
Top 10%10
2700 Stonebridge Blvd
Aurora, IL 60502
(630) 375-3200
Aurora, IL 60502
(630) 375-3200
Grades: K-5
| 707 students
Rank: #1414.
Clifford Crone Middle School
Rank:
10/
Top 10%10
4020 111th St
Naperville, IL 60564
(630) 428-5600
Naperville, IL 60564
(630) 428-5600
Grades: 6-8
| 885 students
Rank: #1515.
Owen Elementary School
Rank:
10/
Top 10%10
1560 Westglen Dr
Naperville, IL 60565
(630) 428-7300
Naperville, IL 60565
(630) 428-7300
Grades: K-5
| 585 students
Rank: #1616.
Reba O Steck Elementary School
Rank:
9/
Top 20%10
460 Inverness Dr
Aurora, IL 60504
(630) 375-3500
Aurora, IL 60504
(630) 375-3500
Grades: K-5
| 670 students
Rank: #1717.
Wayne Builta Elementary School
Rank:
9/
Top 20%10
1835 Apple Valley Rd
Bolingbrook, IL 60490
(630) 226-4400
Bolingbrook, IL 60490
(630) 226-4400
Grades: K-5
| 312 students
Rank: #1818.
Francis Granger Middle School
Rank:
9/
Top 20%10
2721 Stonebridge Blvd
Aurora, IL 60502
(630) 375-1010
Aurora, IL 60502
(630) 375-1010
Grades: 6-8
| 1,013 students
Rank: #1919.
Nancy Young Elementary School
Rank:
9/
Top 20%10
800 Asbury Dr
Aurora, IL 60502
(630) 375-3800
Aurora, IL 60502
(630) 375-3800
Grades: K-5
| 596 students
Rank: #2020.
Mary Lou Cowlishaw Elementary School
Rank:
9/
Top 20%10
1212 Sanctuary Ln
Naperville, IL 60540
(630) 428-6100
Naperville, IL 60540
(630) 428-6100
Grades: K-5
| 564 students
Rank: #2121.
Thayer J Hill Middle School
Rank:
9/
Top 20%10
1836 Brookdale Rd
Naperville, IL 60563
(630) 428-6200
Naperville, IL 60563
(630) 428-6200
Grades: 6-8
| 788 students
Rank: #2222.
Still Middle School
Rank:
9/
Top 20%10
787 Meadowridge Dr
Aurora, IL 60504
(630) 375-3900
Aurora, IL 60504
(630) 375-3900
Grades: 6-8
| 678 students
Rank: #2323.
Peter M Gombert Elementary School
Rank:
8/
Top 30%10
2707 Ridge Rd
Aurora, IL 60504
(630) 375-3700
Aurora, IL 60504
(630) 375-3700
Grades: K-5
| 415 students
Rank: #2424.
Brookdale Elementary School
Rank:
8/
Top 30%10
1200 Redfield Rd
Naperville, IL 60563
(630) 428-6800
Naperville, IL 60563
(630) 428-6800
Grades: K-5
| 457 students
Rank: #2525.
Fischer Middle School
Rank:
6/
Top 50%10
1305 Long Grove Dr
Aurora, IL 60504
(630) 375-3100
Aurora, IL 60504
(630) 375-3100
Grades: 6-8
| 904 students
Rank: #2626.
Longwood Elementary School
Rank:
5/
Bottom 50%10
30w240 Bruce Ln
Naperville, IL 60563
(630) 428-6789
Naperville, IL 60563
(630) 428-6789
Grades: K-5
| 355 students
Rank: #2727.
Georgetown Elementary School
Rank:
4/
Bottom 50%10
995 Long Grove Dr
Aurora, IL 60504
(630) 375-3456
Aurora, IL 60504
(630) 375-3456
Grades: K-5
| 432 students
Rank: #2828.
Mccarty Elementary School
Rank:
4/
Bottom 50%10
3000 Village Green Dr
Aurora, IL 60504
(630) 375-3400
Aurora, IL 60504
(630) 375-3400
Grades: K-5
| 474 students
Recent Articles

What Is A Charter School?
Explore the world of charter schools in this comprehensive guide. Learn about their history, how they operate, and the pros and cons of this educational innovation. Discover key facts about charter schools, including admission policies, demographics, and funding, as well as what to look for when considering a charter school for your child.

10 Reasons Why High School Sports Benefit Students
Discover the 10 compelling reasons why high school sports are beneficial for students. This comprehensive article explores how athletics enhance academic performance, foster personal growth, and develop crucial life skills. From improved fitness and time management to leadership development and community representation, learn why participating in high school sports can be a game-changer for students' overall success and well-being.

February 05, 2025
Understanding the U.S. Department of Education: Structure, Impact, and EvolutionWe explore how the Department of Education shapes American education, from its cabinet-level leadership to its impact on millions of students, written for general audiences seeking clarity on this vital institution.


