For the 2025 school year, there is 1 public school in Wabash & Ohio Valley Special Educational School District.
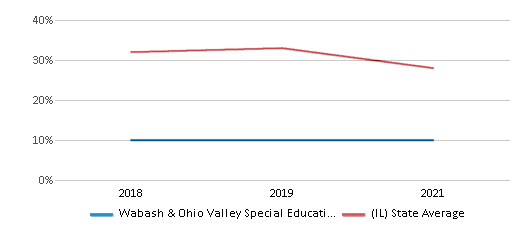
Public School in Wabash & Ohio Valley Special Educational School District have an average math proficiency score of 10% (versus the Illinois public school average of 26%).
Overview
This School District
This State (IL)
# Schools
1 School
4,399 Schools
# Students
n/a
1,881,773 Students
# Teachers
11 Teachers
136,664 Teachers
Student : Teacher Ratio
n/a
n/a
District Rank
Math Test Scores (% Proficient)
(20-21)≤10%
28%
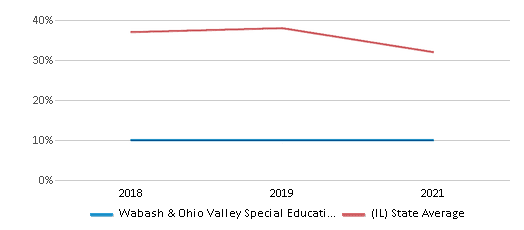
Reading/Language Arts Test Scores (% Proficient)
(20-21)≤10%
32%
Students by Ethnicity:
Diversity Score
-
0.70
# American Indian Students
n/a
4,556 Students
% American Indian Students
n/a
1%
# Asian Students
n/a
103,630 Students
% Asian Students
n/a
6%
# Hispanic Students
n/a
517,685 Students
% Hispanic Students
n/a
28%
# Black Students
n/a
303,129 Students
% Black Students
n/a
16%
# White Students
n/a
837,178 Students
% White Students
n/a
45%
# Hawaiian Students
n/a
1,684 Students
% Hawaiian Students
n/a
n/a
# Two or more races Students
n/a
78,057 Students
% of Two or more races Students
n/a
4%
Students by Grade:
# Students in PK Grade:
-
79,660
# Students in K Grade:
-
120,716
# Students in 1st Grade:
-
126,380
# Students in 2nd Grade:
-
167,371
# Students in 3rd Grade:
-
130,316
# Students in 4th Grade:
-
130,337
# Students in 5th Grade:
-
129,914
# Students in 6th Grade:
-
132,189
# Students in 7th Grade:
-
135,696
# Students in 8th Grade:
-
137,626
# Students in 9th Grade:
-
149,483
# Students in 10th Grade:
-
150,499
# Students in 11th Grade:
-
146,819
# Students in 12th Grade:
-
144,755
# Ungraded Students:
-
12
District Revenue and Spending
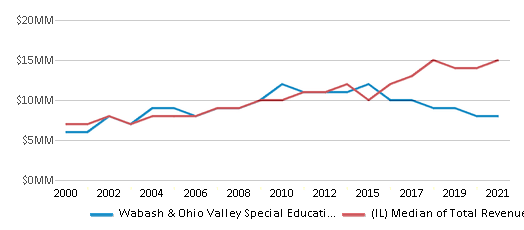
Total Revenue
$8 MM
$41,381 MM
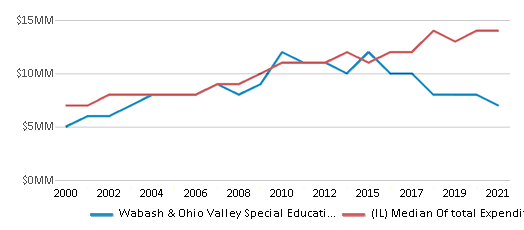
Spending
$7 MM
$39,976 MM
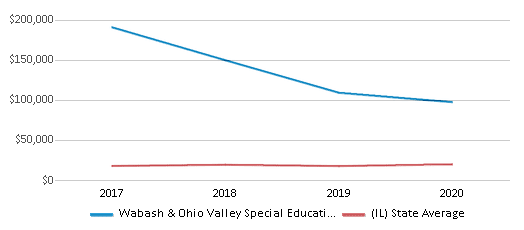
Revenue / Student (19-20)
$97,519
$19,707
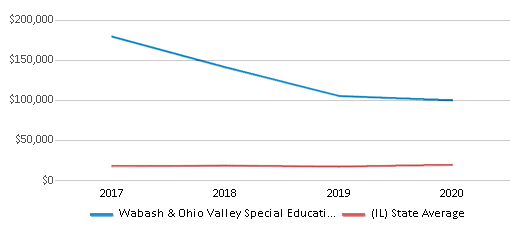
Spending / Student (19-20)
$99,704
$19,097
Best Wabash & Ohio Valley Special Educational School District Public Schools (2025)
School
(Math and Reading Proficiency)
(Math and Reading Proficiency)
Location
Grades
Students
Rank: #11.
Norris City Annex
Special Education School
(Math: ≤10% | Reading: ≤10% )
Rank:
Rank:
2/
Bottom 50%10
305 N Powell St
Norris City, IL 62869
(618) 378-3324
Norris City, IL 62869
(618) 378-3324
Grades: n/a
| n/a students
Frequently Asked Questions
How many schools belong to Wabash & Ohio Valley Special Educational School District?
Wabash & Ohio Valley Special Educational School District manages 1 public schools.
Recent Articles

Year-Round Or Traditional Schedule?
Which is more appropriate for your child? A year-round attendance schedule or traditional schedule? We look at the pros and cons.

Why You Should Encourage Your Child to Join a Sports Team
Participating in team sports has a great many benefits for children, there is no doubt. In this article you will learn what those benefits are.

White Students are Now the Minority in U.S. Public Schools
Increasing birth rates among immigrant families from Asia and Central and South America, combined with lower birth rates among white families, means that for the first time in history, public school students in the United States are majority-minority. This shift in demographics poses difficulties for schools as they work to accommodate children of varying language abilities and socio-economic backgrounds.


