For the 2025 school year, there are 3 public elementary schools serving 758 students in Southeast Valley Community School District. This district's average elementary testing ranking is 3/10, which is in the bottom 50% of public elementary schools in Iowa.
Public Elementary Schools in Southeast Valley Community School District have an average math proficiency score of 55% (versus the Iowa public elementary school average of 66%), and reading proficiency score of 70% (versus the 69% statewide average).
Minority enrollment is 10% of the student body (majority Hispanic), which is less than the Iowa public elementary school average of 29% (majority Hispanic).
Overview
This School District
This State (IA)
# Schools
4 Schools
924 Schools
# Students
1,100 Students
320,020 Students
# Teachers
77 Teachers
23,100 Teachers
Student : Teacher Ratio
14:1
14:1
District Rank
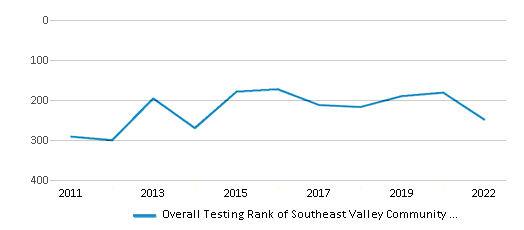
Southeast Valley Community School District, which is ranked within the bottom 50% of all 325 school districts in Iowa (based off of combined math and reading proficiency testing data) for the 2021-2022 school year.
Overall District Rank
#249 out of 327 school districts
(Bottom 50%)
(Bottom 50%)
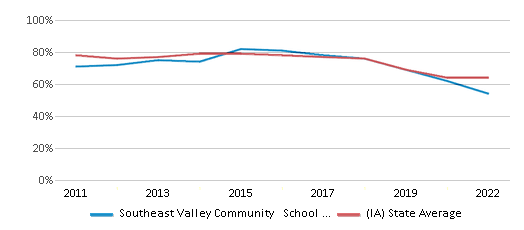
Math Test Scores (% Proficient)
54%
64%
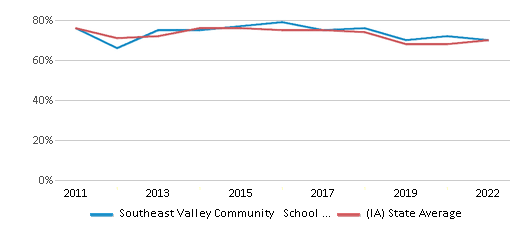
Reading/Language Arts Test Scores (% Proficient)
70%
70%
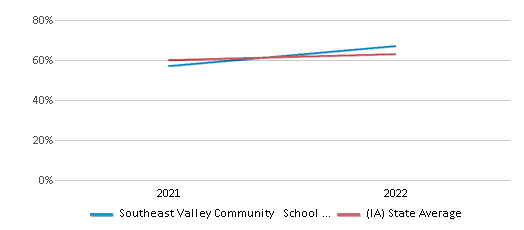
Science Test Scores (% Proficient)
65-69%
63%
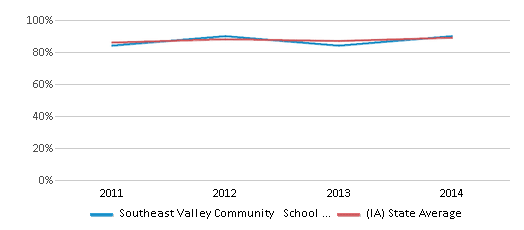
Graduation Rate
(13-14)≥90%
89%
Students by Ethnicity:
Diversity Score
0.17
0.47
# American Indian Students
5 Students
1,327 Students
% American Indian Students
1%
n/a
# Asian Students
4 Students
7,817 Students
% Asian Students
n/a
3%
# Hispanic Students
35 Students
40,728 Students
% Hispanic Students
3%
13%
# Black Students
6 Students
22,463 Students
% Black Students
1%
7%
# White Students
1,004 Students
228,520 Students
% White Students
91%
71%
# Hawaiian Students
n/a
2,308 Students
% Hawaiian Students
n/a
1%
# Two or more races Students
46 Students
16,789 Students
% of Two or more races Students
4%
5%
Students by Grade:
# Students in PK Grade:
70
17,527
# Students in K Grade:
92
35,055
# Students in 1st Grade:
62
34,545
# Students in 2nd Grade:
67
35,477
# Students in 3rd Grade:
83
35,334
# Students in 4th Grade:
69
35,902
# Students in 5th Grade:
76
35,813
# Students in 6th Grade:
84
35,551
# Students in 7th Grade:
78
24,719
# Students in 8th Grade:
77
22,978
# Students in 9th Grade:
88
1,729
# Students in 10th Grade:
80
1,838
# Students in 11th Grade:
90
1,809
# Students in 12th Grade:
84
1,743
# Ungraded Students:
-
-
District Revenue and Spending
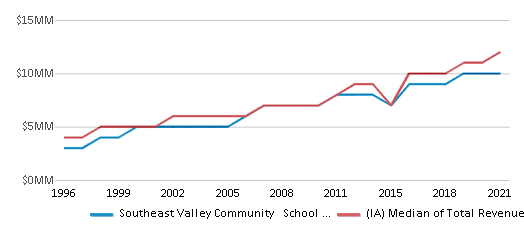
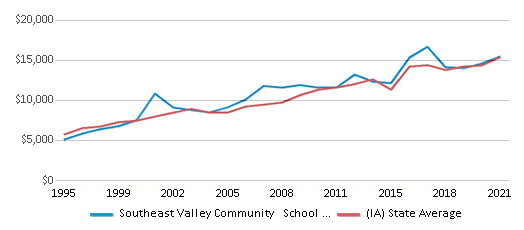
The revenue/student of $9,314 in this school district is less than the state median of $16,468. The school district revenue/student has declined by 52% over four school years.
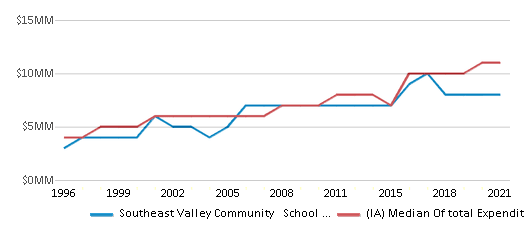
The school district's spending/student of $7,410 is less than the state median of $16,042. The school district spending/student has declined by 52% over four school years.
Total Revenue
$10 MM
$8,262 MM
Spending
$8 MM
$8,048 MM
Revenue / Student
$9,314
$16,468
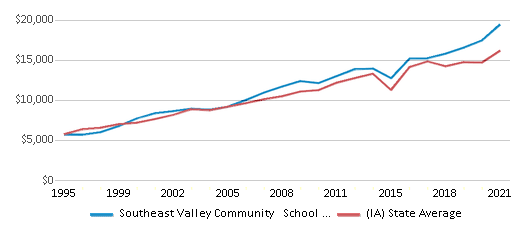
Spending / Student
$7,410
$16,042
Best Southeast Valley Community School District Public Elementary Schools (2025)
School
(Math and Reading Proficiency)
(Math and Reading Proficiency)
Location
Grades
Students
Rank: #11.
Dayton Center
(Math: 70-74% | Reading: 70-74%)
Rank:
Rank:
7/
Top 50%10
104 2nd St. Nw
Dayton, IA 50530
(515) 547-2314
Dayton, IA 50530
(515) 547-2314
Grades: PK-4
| 205 students
Rank: #22.
Southeast Valley Middle School
(Math: 50% | Reading: 70%)
Rank:
Rank:
3/
Bottom 50%10
30850 Paragon Ave.
Burnside, IA 50521
(515) 359-2235
Burnside, IA 50521
(515) 359-2235
Grades: 5-8
| 315 students
Rank: n/an/a
3116 Zearing Ave
Farnhamville, IA 50538
(515) 370-2861
Farnhamville, IA 50538
(515) 370-2861
Grades: PK-4
| 238 students
Recent Articles

Sexual Harassment at Age 6: The Tale of a First Grade Suspension
A six-year old in Aurora, Colorado, was suspended after singing an LMFAO song to a little girl in his class and reportedly “shaking his booty.” We look at the case and the sexual harassment problem in public schools today.

How Scaffolding Could Change the Way Your Child Learns
This article explores the concept of instructional scaffolding, a teaching method that enhances learning by breaking down complex tasks into manageable parts. It highlights how scaffolding supports students in developing critical thinking skills and becoming more independent learners. The article discusses the benefits of scaffolding, including improved engagement and reduced anxiety, and provides strategies for its implementation across various educational levels.

February 05, 2025
Understanding the U.S. Department of Education: Structure, Impact, and EvolutionWe explore how the Department of Education shapes American education, from its cabinet-level leadership to its impact on millions of students, written for general audiences seeking clarity on this vital institution.


