Top Rankings
Fayette County School District ranks among the top 20% of public school district in Kentucky for:
Category
Attribute
Diversity
Most diverse schools (Top 1%)
Community Size
Largest student body (number of students) (Top 1%)
Student Attention
Lowest student:teacher ratio (Top 1%)
For the 2025 school year, there are 59 public elementary schools serving 29,078 students in Fayette County School District. This district's average elementary testing ranking is 8/10, which is in the top 30% of public elementary schools in Kentucky.
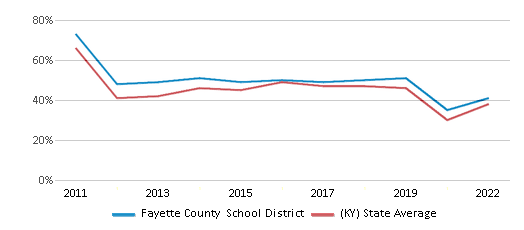
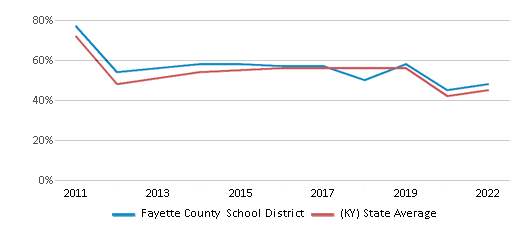
Public Elementary Schools in Fayette County School District have an average math proficiency score of 41% (versus the Kentucky public elementary school average of 38%), and reading proficiency score of 48% (versus the 45% statewide average).
Minority enrollment is 57% of the student body (majority Black and Hispanic), which is more than the Kentucky public elementary school average of 28% (majority Black and Hispanic).
Overview
This School District
This State (KY)
# Schools
78 Schools
1,082 Schools
# Students
41,697 Students
447,292 Students
# Teachers
3,113 Teachers
30,346 Teachers
Student : Teacher Ratio
14:1
14:1
District Rank
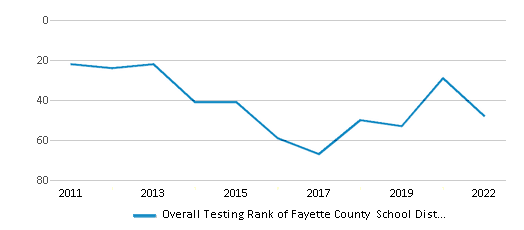
Fayette County School District, which is ranked within the top 30% of all 171 school districts in Kentucky (based off of combined math and reading proficiency testing data) for the 2021-2022 school year.
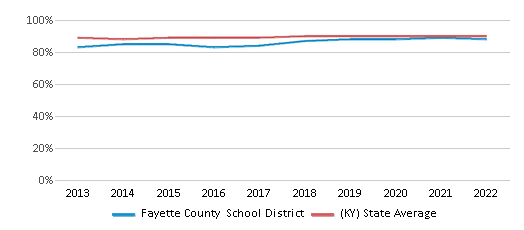
The school district's graduation rate of 88% has increased from 84% over five school years.
Overall District Rank
#48 out of 172 school districts
(Top 30%)
(Top 30%)
Math Test Scores (% Proficient)
41%
38%
Reading/Language Arts Test Scores (% Proficient)
48%
45%
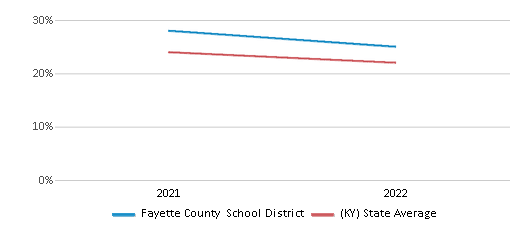
Science Test Scores (% Proficient)
25%
22%
Graduation Rate
88%
90%
Students by Ethnicity:
Diversity Score
0.71
0.47
# American Indian Students
57 Students
599 Students
% American Indian Students
n/a
n/a
# Asian Students
2,177 Students
9,451 Students
% Asian Students
5%
2%
# Hispanic Students
8,771 Students
42,759 Students
% Hispanic Students
21%
9%
# Black Students
9,729 Students
48,507 Students
% Black Students
24%
11%
# White Students
18,064 Students
320,102 Students
% White Students
43%
72%
# Hawaiian Students
38 Students
837 Students
% Hawaiian Students
n/a
n/a
# Two or more races Students
2,861 Students
25,037 Students
% of Two or more races Students
7%
6%
Students by Grade:
# Students in PK Grade:
969
18,112
# Students in K Grade:
3,045
45,031
# Students in 1st Grade:
3,108
49,074
# Students in 2nd Grade:
3,281
50,429
# Students in 3rd Grade:
3,004
46,939
# Students in 4th Grade:
3,104
47,705
# Students in 5th Grade:
3,109
48,100
# Students in 6th Grade:
2,764
44,625
# Students in 7th Grade:
3,124
41,483
# Students in 8th Grade:
3,032
42,059
# Students in 9th Grade:
3,724
3,504
# Students in 10th Grade:
3,369
3,532
# Students in 11th Grade:
3,275
3,553
# Students in 12th Grade:
2,764
3,094
# Ungraded Students:
25
52
District Revenue and Spending
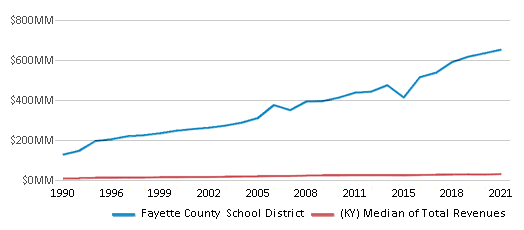
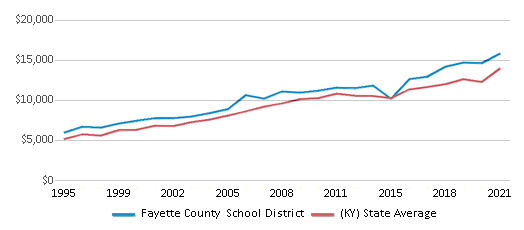
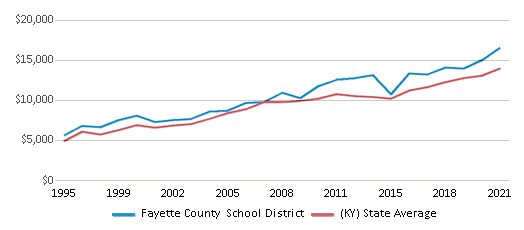
The revenue/student of $15,632 is higher than the state median of $14,242. The school district revenue/student has stayed relatively flat over four school years.
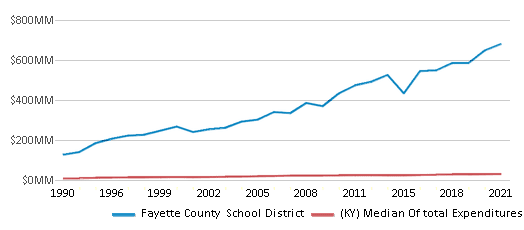
The school district's spending/student of $16,331 is higher than the state median of $13,981. The school district spending/student has stayed relatively flat over four school years.
Total Revenue
$652 MM
$9,360 MM
Spending
$681 MM
$9,189 MM
Revenue / Student
$15,632
$14,242
Spending / Student
$16,331
$13,981
Best Fayette County School District Public Elementary Schools (2025)
School
(Math and Reading Proficiency)
(Math and Reading Proficiency)
Location
Grades
Students
Rank: #11.
Scapa At Bluegrass
(Math: 80% | Reading: 84%)
Rank:
Rank:
10/
Top 1%10
400 Lafayette Pkwy
Lexington, KY 40503
(859) 381-3332
Lexington, KY 40503
(859) 381-3332
Grades: 4-8
| 300 students
Rank: #22.
Rosa Parks Elementary School
(Math: 70% | Reading: 77%)
Rank:
Rank:
10/
Top 5%10
1251 Beaumont Centre Lane
Lexington, KY 40513
(859) 381-3132
Lexington, KY 40513
(859) 381-3132
Grades: K-5
| 708 students
Rank: #33.
Athens-chilesburg Elementary School
(Math: 71% | Reading: 76%)
Rank:
Rank:
10/
Top 5%10
930 Jouett Creek Dr
Lexington, KY 40509
(859) 381-4955
Lexington, KY 40509
(859) 381-4955
Grades: K-5
| 570 students
Rank: #44.
Clays Mill Elementary School
(Math: 63% | Reading: 72%)
Rank:
Rank:
10/
Top 5%10
2319 Clays Mill Rd
Lexington, KY 40503
(859) 381-3355
Lexington, KY 40503
(859) 381-3355
Grades: K-5
| 520 students
Rank: #55.
Ashland Elementary School
(Math: 60-64% | Reading: 65-69%)
Rank:
Rank:
10/
Top 5%10
195 N Ashland Ave
Lexington, KY 40502
(859) 381-3243
Lexington, KY 40502
(859) 381-3243
Grades: K-5
| 281 students
Rank: #66.
Cassidy Elementary School
(Math: 64% | Reading: 66%)
Rank:
Rank:
10/
Top 5%10
1125 Tates Creek Road
Lexington, KY 40502
(859) 381-3018
Lexington, KY 40502
(859) 381-3018
Grades: K-5
| 645 students
Rank: #77.
Meadowthorpe Elementary School
(Math: 63% | Reading: 65%)
Rank:
Rank:
10/
Top 5%10
1710 N. Forbes Rd
Lexington, KY 40505
(859) 381-3521
Lexington, KY 40505
(859) 381-3521
Grades: PK-5
| 458 students
Rank: #88.
Veterans Park Elementary School
(Math: 63% | Reading: 62%)
Rank:
Rank:
10/
Top 10%10
4351 Clearwater Way
Lexington, KY 40515
(859) 381-3161
Lexington, KY 40515
(859) 381-3161
Grades: K-5
| 697 students
Rank: #99.
Edythe Jones Hayes Middle School
(Math: 59% | Reading: 64%)
Rank:
Rank:
10/
Top 10%10
260 Richardson Place
Lexington, KY 40509
(859) 381-4920
Lexington, KY 40509
(859) 381-4920
Grades: 6-8
| 1,070 students
Rank: #1010.
Garrett Morgan Elementary School
(Math: 54% | Reading: 67%)
Rank:
Rank:
10/
Top 10%10
1150 Passage Mound Way
Lexington, KY 40509
(859) 381-3165
Lexington, KY 40509
(859) 381-3165
Grades: K-5
| 780 students
Rank: #1111.
Wellington Elementary School
(Math: 56% | Reading: 63%)
Rank:
Rank:
10/
Top 10%10
3280 Keithshire Way
Lexington, KY 40503
(859) 381-3000
Lexington, KY 40503
(859) 381-3000
Grades: PK-5
| 604 students
Rank: #1212.
Sandersville Elementary School
(Math: 57% | Reading: 61%)
Rank:
Rank:
10/
Top 10%10
3025 Sandersville Rd
Lexington, KY 40511
(859) 381-4980
Lexington, KY 40511
(859) 381-4980
Grades: PK-5
| 769 students
Rank: #1313.
Morton Middle School
(Math: 53% | Reading: 62%)
Rank:
Rank:
10/
Top 10%10
1225 Tates Creek Pk
Lexington, KY 40502
(859) 381-3533
Lexington, KY 40502
(859) 381-3533
Grades: 6-8
| 641 students
Rank: #1414.
Squires Elementary School
(Math: 55-59% | Reading: 55-59%)
Rank:
Rank:
9/
Top 20%10
3337 Squire Oak Dr.
Lexington, KY 40515
(859) 381-3002
Lexington, KY 40515
(859) 381-3002
Grades: PK-5
| 419 students
Rank: #1515.
Glendover Elementary School
(Math: 54% | Reading: 59%)
Rank:
Rank:
9/
Top 20%10
710 Glendover Rd
Lexington, KY 40502
(859) 381-3403
Lexington, KY 40502
(859) 381-3403
Grades: PK-5
| 463 students
Rank: #1616.
Brenda Cowan Elementary School
(Math: 56% | Reading: 57%)
Rank:
Rank:
9/
Top 20%10
4801 Athens-boonesboro Road
Lexington, KY 40509
(859) 381-4000
Lexington, KY 40509
(859) 381-4000
Grades: PK-5
| 570 students
Rank: #1717.
Jessie M Clark Middle School
(Math: 52% | Reading: 57%)
Rank:
Rank:
9/
Top 20%10
3341 Clays Mill Rd
Lexington, KY 40503
(859) 381-3036
Lexington, KY 40503
(859) 381-3036
Grades: 6-8
| 985 students
Rank: #1818.
Maxwell Spanish Immersion Elementary School
Magnet School
(Math: 51% | Reading: 58%)
Rank:
Rank:
9/
Top 20%10
301 Woodland Ave
Lexington, KY 40508
(859) 381-3516
Lexington, KY 40508
(859) 381-3516
Grades: K-5
| 560 students
Rank: #1919.
Beaumont Middle School
(Math: 50% | Reading: 55%)
Rank:
Rank:
9/
Top 20%10
2080 Georgian Way
Lexington, KY 40504
(859) 381-3094
Lexington, KY 40504
(859) 381-3094
Grades: 6-8
| 757 students
Rank: #2020.
Stonewall Elementary School
(Math: 49% | Reading: 56%)
Rank:
Rank:
9/
Top 20%10
3215 Cornwall Dr
Lexington, KY 40503
(859) 381-3079
Lexington, KY 40503
(859) 381-3079
Grades: PK-5
| 673 students
Rank: #21 - 2221. - 22.
Audrey Grevious Center
Alternative School
(Math: <50% | Reading: <50%)
Rank:
Rank:
8/
Top 30%10
1177 Harry Sykes Way
Lexington, KY 40504
(859) 246-4370
Lexington, KY 40504
(859) 246-4370
Grades: 6-12
| 18 students
Rank: #21 - 2221. - 22.
Success Academy
Alternative School
(Math: <50% | Reading: <50%)
Rank:
Rank:
8/
Top 30%10
1555 Georgetown Road
Lexington, KY 40508
(859) 381-4000
Lexington, KY 40508
(859) 381-4000
Grades: 6-12
| 366 students
Rank: #2323.
Liberty Elementary School
(Math: 40% | Reading: 50%)
Rank:
Rank:
7/
Top 50%10
2585 Liberty Rd
Lexington, KY 40509
(859) 381-4979
Lexington, KY 40509
(859) 381-4979
Grades: K-5
| 726 students
Rank: #2424.
Picadome Elementary School
(Math: 40-44% | Reading: 45-49%)
Rank:
Rank:
7/
Top 50%10
1642 Harrodsburg Rd
Lexington, KY 40504
(859) 381-3563
Lexington, KY 40504
(859) 381-3563
Grades: PK-5
| 436 students
Rank: #2525.
Garden Springs Elementary School
(Math: 41% | Reading: 49%)
Rank:
Rank:
7/
Top 50%10
2151 Garden Springs Dr
Lexington, KY 40504
(859) 381-3388
Lexington, KY 40504
(859) 381-3388
Grades: K-5
| 414 students
Rank: #2626.
Carter G. Woodson Academy
Alternative School
Magnet School
Magnet School
(Math: 35-39% | Reading: 45-49%)
Rank:
Rank:
6/
Top 50%10
2000 Winchester Road
Lexington, KY 40509
(859) 381-3933
Lexington, KY 40509
(859) 381-3933
Grades: 6-12
| 305 students
Rank: #2727.
Leestown Middle School
(Math: 37% | Reading: 46%)
Rank:
Rank:
6/
Top 50%10
2010 Leestown Rd
Lexington, KY 40511
(859) 381-3181
Lexington, KY 40511
(859) 381-3181
Grades: 6-8
| 944 students
Rank: #2828.
Madeline M Breckinridge Elementary School
(Math: 38% | Reading: 43%)
Rank:
Rank:
5/
Bottom 50%10
2101 St. Mathilda Dr.
Lexington, KY 40502
(859) 381-3273
Lexington, KY 40502
(859) 381-3273
Grades: PK-5
| 557 students
Rank: #2929.
Southern Middle School
(Math: 34% | Reading: 42%)
Rank:
Rank:
5/
Bottom 50%10
400 Wilson-downing Rd
Lexington, KY 40517
(859) 381-3582
Lexington, KY 40517
(859) 381-3582
Grades: 6-8
| 764 students
Rank: #3030.
Dixie Elementary Magnet School
Magnet School
(Math: 36% | Reading: 40%)
Rank:
Rank:
5/
Bottom 50%10
1940 Eastland Pkwy
Lexington, KY 40505
(859) 381-3116
Lexington, KY 40505
(859) 381-3116
Grades: PK-5
| 587 students
Rank: #3131.
Bryan Station Middle School
Magnet School
(Math: 30% | Reading: 44%)
Rank:
Rank:
4/
Bottom 50%10
1865 Wickland Dr
Lexington, KY 40505
(859) 381-3288
Lexington, KY 40505
(859) 381-3288
Grades: 6-8
| 720 students
Rank: #3232.
Tates Creek Middle School
(Math: 32% | Reading: 38%)
Rank:
Rank:
4/
Bottom 50%10
1105 Centre Pkwy
Lexington, KY 40517
(859) 381-3052
Lexington, KY 40517
(859) 381-3052
Grades: 6-8
| 737 students
Rank: #3333.
Julius Marks Elementary School
(Math: 33% | Reading: 37%)
Rank:
Rank:
4/
Bottom 50%10
3277 Pepperhill Rd
Lexington, KY 40502
(859) 381-3470
Lexington, KY 40502
(859) 381-3470
Grades: PK-5
| 479 students
Rank: #3434.
Lansdowne Elementary School
(Math: 34% | Reading: 36%)
Rank:
Rank:
4/
Bottom 50%10
336 Redding Rd
Lexington, KY 40517
(859) 381-3500
Lexington, KY 40517
(859) 381-3500
Grades: PK-5
| 591 students
Rank: #3535.
Tates Creek Elementary School
(Math: 31% | Reading: 37%)
Rank:
Rank:
4/
Bottom 50%10
1113 Centre Pkwy
Lexington, KY 40517
(859) 381-3606
Lexington, KY 40517
(859) 381-3606
Grades: PK-5
| 661 students
Show 24 more public schools in Fayette County School District (out of 59 total schools)
Loading...
Recent Articles

Sexual Harassment at Age 6: The Tale of a First Grade Suspension
A six-year old in Aurora, Colorado, was suspended after singing an LMFAO song to a little girl in his class and reportedly “shaking his booty.” We look at the case and the sexual harassment problem in public schools today.

How Scaffolding Could Change the Way Your Child Learns
This article explores the concept of instructional scaffolding, a teaching method that enhances learning by breaking down complex tasks into manageable parts. It highlights how scaffolding supports students in developing critical thinking skills and becoming more independent learners. The article discusses the benefits of scaffolding, including improved engagement and reduced anxiety, and provides strategies for its implementation across various educational levels.

February 05, 2025
Understanding the U.S. Department of Education: Structure, Impact, and EvolutionWe explore how the Department of Education shapes American education, from its cabinet-level leadership to its impact on millions of students, written for general audiences seeking clarity on this vital institution.


