Top Rankings
Prince George's County School District ranks among the top 20% of public school district in Maryland for:
Category
Attribute
Community Size
Largest student body (number of students) (Top 1%)
For the 2025 school year, there are 35 public high schools serving 42,891 students in Prince George's County School District. This district's average high testing ranking is 3/10, which is in the bottom 50% of public high schools in Maryland.
Public High Schools in Prince George's County School District have an average math proficiency score of 17% (versus the Maryland public high school average of 32%), and reading proficiency score of 48% (versus the 56% statewide average).
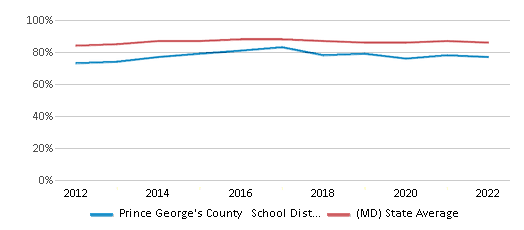
Public High School in Prince George's County School District have a Graduation Rate of 77%, which is less than the Maryland average of 87%.
The school with highest graduation rate is Academy Of Health Sciences At Pgcc, with ≥95% graduation rate. Read more about public school graduation rate statistics in Maryland or national school graduation rate statistics.
Minority enrollment is 97% of the student body (majority Black), which is more than the Maryland public high school average of 68% (majority Black).
Overview
This School District
This State (MD)
# Schools
203 Schools
287 Schools
# Students
131,339 Students
285,722 Students
# Teachers
8,710 Teachers
18,478 Teachers
Student : Teacher Ratio
15:1
15:1
District Rank
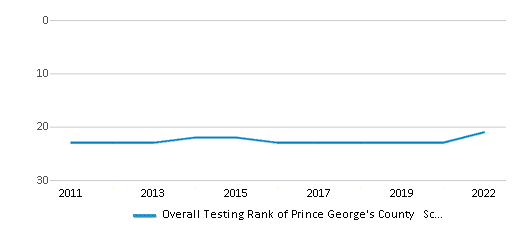
Prince George's County School District, which is ranked within the bottom 50% of all 25 school districts in Maryland (based off of combined math and reading proficiency testing data) for the 2021-2022 school year.
The school district's graduation rate of 77% has decreased from 83% over five school years.
Overall District Rank
#21 out of 25 school districts
(Bottom 50%)
(Bottom 50%)
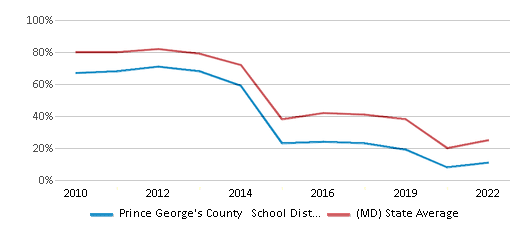
Math Test Scores (% Proficient)
11%
25%
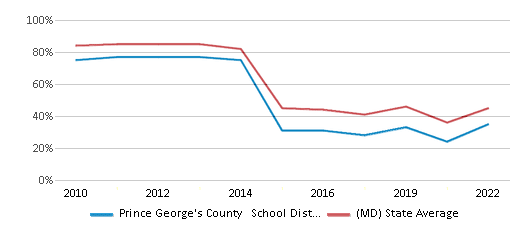
Reading/Language Arts Test Scores (% Proficient)
35%
45%
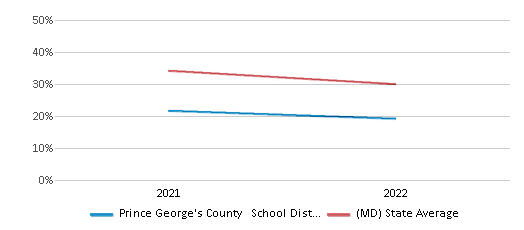
Science Test Scores (% Proficient)
23%
36%
Graduation Rate
77%
86%
Students by Ethnicity:
Diversity Score
0.58
0.73
# American Indian Students
526 Students
755 Students
% American Indian Students
1%
n/a
# Asian Students
3,600 Students
19,388 Students
% Asian Students
3%
7%
# Hispanic Students
52,639 Students
62,415 Students
% Hispanic Students
40%
22%
# Black Students
67,371 Students
97,212 Students
% Black Students
51%
34%
# White Students
5,158 Students
92,053 Students
% White Students
4%
32%
# Hawaiian Students
273 Students
432 Students
% Hawaiian Students
n/a
n/a
# Two or more races Students
1,766 Students
13,026 Students
% of Two or more races Students
1%
5%
Students by Grade:
# Students in PK Grade:
4,762
220
# Students in K Grade:
9,228
395
# Students in 1st Grade:
9,526
429
# Students in 2nd Grade:
9,903
384
# Students in 3rd Grade:
9,229
412
# Students in 4th Grade:
9,650
461
# Students in 5th Grade:
9,560
426
# Students in 6th Grade:
9,681
1,462
# Students in 7th Grade:
9,739
1,489
# Students in 8th Grade:
9,847
1,726
# Students in 9th Grade:
13,186
79,802
# Students in 10th Grade:
10,275
72,380
# Students in 11th Grade:
8,822
64,963
# Students in 12th Grade:
7,931
61,173
# Ungraded Students:
-
-
District Revenue and Spending
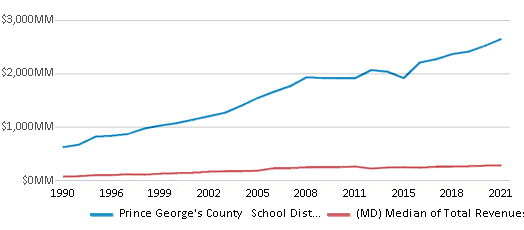
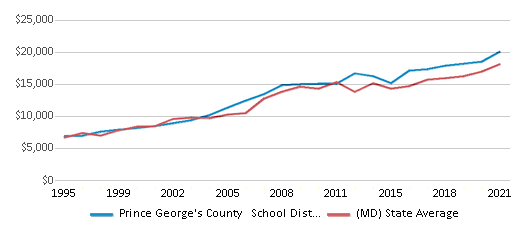
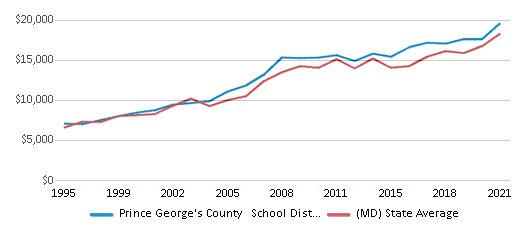
The revenue/student of $20,147 is higher than the state median of $19,554. The school district revenue/student has stayed relatively flat over four school years.
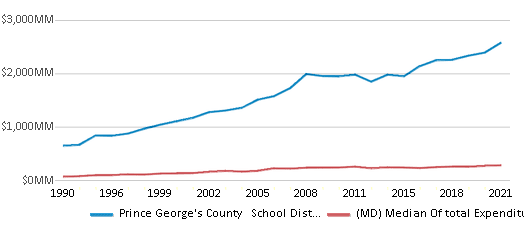
The school district's spending/student of $19,625 is higher than the state median of $18,481. The school district spending/student has stayed relatively flat over four school years.
Total Revenue
$2,646 MM
$17,412 MM
Spending
$2,578 MM
$16,456 MM
Revenue / Student
$20,147
$19,554
Spending / Student
$19,625
$18,481
Best Prince George's County School District Public High Schools (2025)
School
(Math and Reading Proficiency)
(Math and Reading Proficiency)
Location
Grades
Students
Rank: #11.
Academy Of Health Sciences At Pgcc
Magnet School
(Math: 55-59% | Reading: 85-89%)
Rank:
Rank:
10/
Top 5%10
301 Largo Rd
Upper Marlboro, MD 20774
(301) 546-7247
Upper Marlboro, MD 20774
(301) 546-7247
Grades: 9-12
| 407 students
Rank: #22.
Eleanor Roosevelt High School
Magnet School
(Math: 53% | Reading: 76%)
Rank:
Rank:
10/
Top 10%10
7601 Hanover Pkwy
Greenbelt, MD 20770
(301) 513-5400
Greenbelt, MD 20770
(301) 513-5400
Grades: 9-12
| 2,557 students
Rank: #33.
Oxon Hill High School
Magnet School
(Math: 28% | Reading: 69%)
Rank:
Rank:
8/
Top 30%10
6701 Leyte Dr
Oxon Hill, MD 20745
(301) 749-4300
Oxon Hill, MD 20745
(301) 749-4300
Grades: 9-12
| 1,581 students
Rank: #44.
Chesapeake Math And It Public Charter
Charter School
(Math: 27% | Reading: 57%)
Rank:
Rank:
7/
Top 50%10
14800 Sweitzer Ln
Laurel, MD 20707
(301) 350-6051
Laurel, MD 20707
(301) 350-6051
Grades: K-12
| 1,686 students
Rank: #55.
Charles Herbert Flowers High School
Magnet School
(Math: 26% | Reading: 56%)
Rank:
Rank:
7/
Top 50%10
10001 Ardwick-ardmore Rd
Upper Marlboro, MD 20774
(301) 636-8000
Upper Marlboro, MD 20774
(301) 636-8000
Grades: 9-12
| 2,779 students
Rank: #6 - 76. - 7.
Bowie High School
(Math: 17% | Reading: 59%)
Rank:
Rank:
6/
Top 50%10
15200 Annapolis Rd
Bowie, MD 20715
(301) 805-2600
Bowie, MD 20715
(301) 805-2600
Grades: 9-12
| 2,534 students
Rank: #6 - 76. - 7.
College Park Academy
Charter School
(Math: 17% | Reading: 59%)
Rank:
Rank:
6/
Top 50%10
5751 Rivertech Ct
Riverdale, MD 20737
(240) 696-3206
Riverdale, MD 20737
(240) 696-3206
Grades: 6-12
| 681 students
Rank: #88.
Green Valley At Edgar Allan Poe
Alternative School
(Math: ≤20% | Reading: <50%)
Rank:
Rank:
6/
Top 50%10
2001 Shadyside Ave
Suitland, MD 20746
(301) 817-3100
Suitland, MD 20746
(301) 817-3100
Grades: 7-10
| 49 students
Rank: #99.
Duval High School
Magnet School
(Math: 17% | Reading: 48%)
Rank:
Rank:
5/
Bottom 50%10
9880 Good Luck Rd
Lanham, MD 20706
(301) 918-8600
Lanham, MD 20706
(301) 918-8600
Grades: 9-12
| 2,484 students
Rank: #1010.
Frederick Douglass High School
Magnet School
(Math: 10-14% | Reading: 50-54%)
Rank:
Rank:
5/
Bottom 50%10
8000 Croom Rd
Upper Marlboro, MD 20772
(301) 952-2400
Upper Marlboro, MD 20772
(301) 952-2400
Grades: 9-12
| 1,182 students
Rank: #1111.
Chesapeake Math And It South Public Charter
Charter School
(Math: 15% | Reading: 47%)
Rank:
Rank:
5/
Bottom 50%10
9822 Fallard Ct
Upper Marlboro, MD 20772
(240) 573-7250
Upper Marlboro, MD 20772
(240) 573-7250
Grades: K-12
| 1,500 students
Rank: #1212.
Largo High School
Magnet School
(Math: 6-9% | Reading: 50-54%)
Rank:
Rank:
5/
Bottom 50%10
505 Largo Rd
Upper Marlboro, MD 20774
(301) 808-8880
Upper Marlboro, MD 20774
(301) 808-8880
Grades: 9-12
| 1,033 students
Rank: #1313.
Parkdale High School
Magnet School
(Math: 12% | Reading: 43%)
Rank:
Rank:
5/
Bottom 50%10
6001 Good Luck Rd
Riverdale, MD 20737
(301) 513-5700
Riverdale, MD 20737
(301) 513-5700
Grades: 9-12
| 2,571 students
Rank: #1414.
Central High School
Magnet School
(Math: 6-9% | Reading: 45-49%)
Rank:
Rank:
4/
Bottom 50%10
200 Cabin Branch Rd
Capitol Heights, MD 20743
(301) 499-7080
Capitol Heights, MD 20743
(301) 499-7080
Grades: 9-12
| 803 students
Rank: #1515.
Laurel High School
Magnet School
(Math: 10% | Reading: 43%)
Rank:
Rank:
4/
Bottom 50%10
8000 Cherry Ln
Laurel, MD 20707
(301) 497-2050
Laurel, MD 20707
(301) 497-2050
Grades: 9-12
| 2,179 students
Rank: #1616.
C. Elizabeth Rieg
Special Education School
(Math: 25-29% | Reading: 15-19%)
Rank:
Rank:
4/
Bottom 50%10
15542 Peach Walker Dr
Bowie, MD 20716
(301) 390-0200
Bowie, MD 20716
(301) 390-0200
Grades: K-12
| 142 students
Rank: #1717.
Surrattsville High School
(Math: 6-9% | Reading: 40-44%)
Rank:
Rank:
4/
Bottom 50%10
6101 Garden Dr
Clinton, MD 20735
(301) 599-2453
Clinton, MD 20735
(301) 599-2453
Grades: 9-12
| 780 students
Rank: #1818.
Dr. Henry A. Wise Jr. High School
(Math: 8% | Reading: 40%)
Rank:
Rank:
4/
Bottom 50%10
12650 Brooke Ln
Upper Marlboro, MD 20772
(301) 780-2100
Upper Marlboro, MD 20772
(301) 780-2100
Grades: 9-12
| 2,270 students
Rank: #1919.
Potomac High School
(Math: 6-9% | Reading: 35-39%)
Rank:
Rank:
4/
Bottom 50%10
5211 Boydell Ave
Oxon Hill, MD 20745
(301) 702-3900
Oxon Hill, MD 20745
(301) 702-3900
Grades: 9-12
| 1,183 students
Rank: #2020.
Friendly High School
(Math: ≤5% | Reading: 40-44%)
Rank:
Rank:
3/
Bottom 50%10
10000 Allentown Rd
Fort Washington, MD 20744
(301) 449-4900
Fort Washington, MD 20744
(301) 449-4900
Grades: 9-12
| 943 students
Rank: #2121.
Bladensburg High School
Magnet School
(Math: 6% | Reading: 41%)
Rank:
Rank:
3/
Bottom 50%10
4200 57th Ave
Bladensburg, MD 20710
(301) 887-6700
Bladensburg, MD 20710
(301) 887-6700
Grades: 9-12
| 2,095 students
Rank: #2222.
High Point High School
(Math: 7% | Reading: 37%)
Rank:
Rank:
3/
Bottom 50%10
3601 Powder Mill Rd
Beltsville, MD 20705
(301) 572-6400
Beltsville, MD 20705
(301) 572-6400
Grades: 9-12
| 2,960 students
Rank: #2323.
Fairmont Heights High School
(Math: 6-9% | Reading: 30-34%)
Rank:
Rank:
3/
Bottom 50%10
6501 Columbia Park Rd
Hyattsville, MD 20785
(301) 925-1360
Hyattsville, MD 20785
(301) 925-1360
Grades: 9-12
| 1,054 students
Rank: #2424.
Suitland High School
Magnet School
(Math: 7% | Reading: 34%)
Rank:
Rank:
3/
Bottom 50%10
5200 Silver Hill Rd
Suitland, MD 20746
(301) 817-0500
Suitland, MD 20746
(301) 817-0500
Grades: 9-12
| 1,719 students
Rank: #2525.
Gwynn Park High School
Magnet School
(Math: 3% | Reading: 38%)
Rank:
Rank:
3/
Bottom 50%10
13800 Brandywine Rd
Brandywine, MD 20613
(301) 372-0140
Brandywine, MD 20613
(301) 372-0140
Grades: 9-12
| 1,155 students
Rank: #2626.
Northwestern High School
Magnet School
(Math: 6% | Reading: 30%)
Rank:
Rank:
2/
Bottom 50%10
7000 Adelphi Rd
Hyattsville, MD 20782
(301) 985-1820
Hyattsville, MD 20782
(301) 985-1820
Grades: 9-12
| 2,381 students
Rank: #2727.
Croom High School
Alternative School
(Math: ≤10% | Reading: ≤20%)
Rank:
Rank:
2/
Bottom 50%10
9400 Surratts Rd
Cheltenham, MD 20623
(301) 372-8846
Cheltenham, MD 20623
(301) 372-8846
Grades: 11-12
| 39 students
Rank: #2828.
Crossland High School
Magnet School
(Math: ≤5% | Reading: 25-29%)
Rank:
Rank:
2/
Bottom 50%10
6901 Temple Hill Rd
Temple Hills, MD 20748
(301) 449-4800
Temple Hills, MD 20748
(301) 449-4800
Grades: 9-12
| 1,202 students
Rank: #29 - 3029. - 30.
James E. Duckworth
Special Education School
(Math: ≤10% | Reading: ≤10%)
Rank:
Rank:
2/
Bottom 50%10
11201 Evans Trl
Beltsville, MD 20705
(301) 572-0620
Beltsville, MD 20705
(301) 572-0620
Grades: K-12
| 88 students
Rank: #29 - 3029. - 30.
Tall Oaks High School
Alternative School
(Math: ≤10% | Reading: ≤10%)
Rank:
Rank:
2/
Bottom 50%10
2112 Church Rd
Bowie, MD 20721
(301) 390-0230
Bowie, MD 20721
(301) 390-0230
Grades: 11-12
| 68 students
Rank: #31 - 3231. - 32.
International High School Langley Park
(Math: ≤5% | Reading: 6-9%)
Rank:
Rank:
1/
Bottom 50%10
5150 Annapolis Rd
Bladensburg, MD 20710
(301) 702-3910
Bladensburg, MD 20710
(301) 702-3910
Grades: 9-12
| 347 students
Rank: #31 - 3231. - 32.
International High School Largo
(Math: ≤5% | Reading: 6-9%)
Rank:
Rank:
1/
Bottom 50%10
505 Largo Rd
Upper Marlboro, MD 20772
(301) 702-3810
Upper Marlboro, MD 20772
(301) 702-3810
Grades: 9-12
| 362 students
Rank: n/an/a
Annapolis Road Academy
Alternative School
2112 Church Rd
Bowie, MD 20721
(301) 209-3580
Bowie, MD 20721
(301) 209-3580
Grades: 9-10
| 77 students
Rank: n/an/a
Howard B. Owens Science Center
Alternative School
9601 Greenbelt Rd
Lanham, MD 20706
(301) 918-8750
Lanham, MD 20706
(301) 918-8750
Grades: K-12
| n/a students
Rank: n/an/a
William Schmidt Environmental Center
Alternative School
18501 Aquasco Rd
Brandywine, MD 20613
(301) 888-1185
Brandywine, MD 20613
(301) 888-1185
Grades: K-12
| n/a students
Recent Articles

What Is A Charter School?
Explore the world of charter schools in this comprehensive guide. Learn about their history, how they operate, and the pros and cons of this educational innovation. Discover key facts about charter schools, including admission policies, demographics, and funding, as well as what to look for when considering a charter school for your child.

10 Reasons Why High School Sports Benefit Students
Discover the 10 compelling reasons why high school sports are beneficial for students. This comprehensive article explores how athletics enhance academic performance, foster personal growth, and develop crucial life skills. From improved fitness and time management to leadership development and community representation, learn why participating in high school sports can be a game-changer for students' overall success and well-being.

February 05, 2025
Understanding the U.S. Department of Education: Structure, Impact, and EvolutionWe explore how the Department of Education shapes American education, from its cabinet-level leadership to its impact on millions of students, written for general audiences seeking clarity on this vital institution.


