For the 2025 school year, there are 2 public elementary schools serving 338 students in Bonner Elementary School District. This district's average elementary testing ranking is 2/10, which is in the bottom 50% of public elementary schools in Montana.
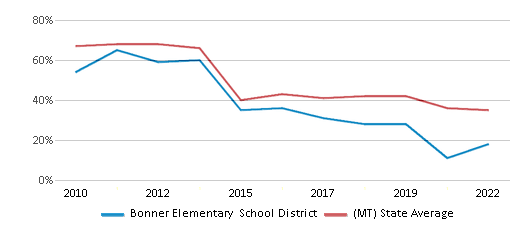
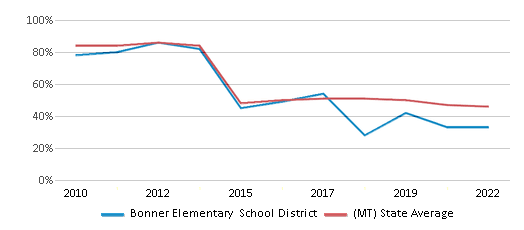
Public Elementary Schools in Bonner Elementary School District have an average math proficiency score of 19% (versus the Montana public elementary school average of 37%), and reading proficiency score of 34% (versus the 46% statewide average).
Minority enrollment is 13% of the student body (majority Hispanic), which is less than the Montana public elementary school average of 24% (majority American Indian).
Overview
This School District
This State (MT)
# Schools
2 Schools
519 Schools
# Students
338 Students
96,346 Students
# Teachers
29 Teachers
6,988 Teachers
Student : Teacher Ratio
12:1
12:1
District Rank
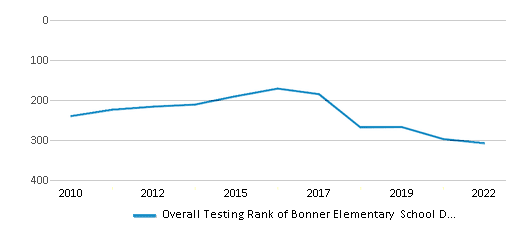
Bonner Elementary School District, which is ranked within the bottom 50% of all 347 school districts in Montana (based off of combined math and reading proficiency testing data) for the 2021-2022 school year.
Overall District Rank
#308 out of 350 school districts
(Bottom 50%)
(Bottom 50%)
Math Test Scores (% Proficient)
18%
35%
Reading/Language Arts Test Scores (% Proficient)
33%
46%
Science Test Scores (% Proficient)
15-19%
37%
Students by Ethnicity:
Diversity Score
0.24
0.40
# American Indian Students
13 Students
10,163 Students
% American Indian Students
4%
11%
# Asian Students
n/a
554 Students
% Asian Students
n/a
1%
# Hispanic Students
17 Students
6,188 Students
% Hispanic Students
5%
6%
# Black Students
1 Student
680 Students
% Black Students
1%
1%
# White Students
295 Students
73,657 Students
% White Students
87%
76%
# Hawaiian Students
1 Student
169 Students
% Hawaiian Students
n/a
n/a
# Two or more races Students
11 Students
4,935 Students
% of Two or more races Students
3%
5%
Students by Grade:
# Students in PK Grade:
3
1,029
# Students in K Grade:
60
11,750
# Students in 1st Grade:
33
10,993
# Students in 2nd Grade:
37
11,771
# Students in 3rd Grade:
38
11,487
# Students in 4th Grade:
28
11,459
# Students in 5th Grade:
30
11,360
# Students in 6th Grade:
35
11,339
# Students in 7th Grade:
36
7,650
# Students in 8th Grade:
38
7,460
# Students in 9th Grade:
-
19
# Students in 10th Grade:
-
12
# Students in 11th Grade:
-
10
# Students in 12th Grade:
-
7
# Ungraded Students:
-
-
District Revenue and Spending
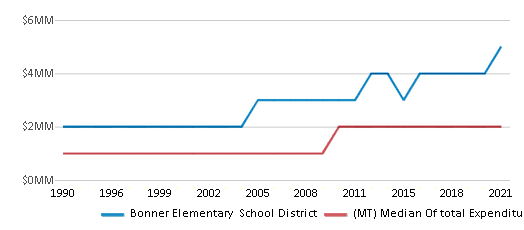
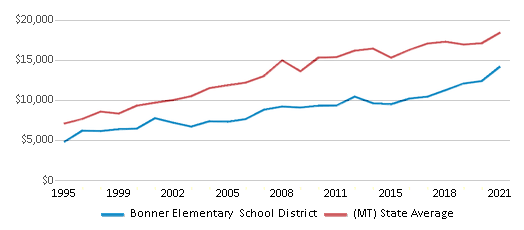
The revenue/student of $14,435 in this school district is less than the state median of $15,263. The school district revenue/student has stayed relatively flat over four school years.
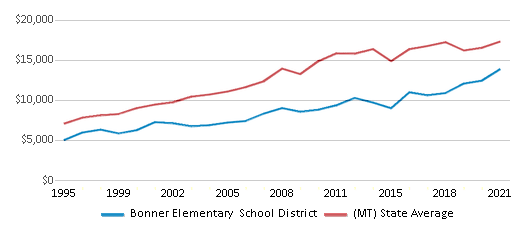
The school district's spending/student of $14,109 is less than the state median of $15,352. The school district spending/student has stayed relatively flat over four school years.
Total Revenue
$5 MM
$2,285 MM
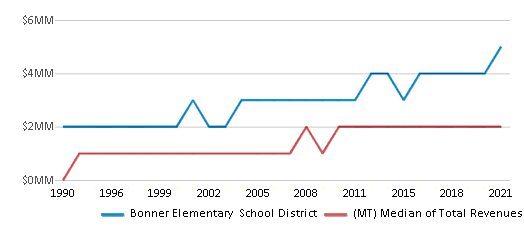
Spending
$5 MM
$2,298 MM
Revenue / Student
$14,435
$15,263
Spending / Student
$14,109
$15,352
Best Bonner Elementary School District Public Elementary Schools (2025)
School
(Math and Reading Proficiency)
(Math and Reading Proficiency)
Location
Grades
Students
Rank: #11.
Bonner School
(Math: 25-29% | Reading: 35-39%)
Rank:
Rank:
3/
Bottom 50%10
9045 Hwy 200 E
Bonner, MT 59823
(406) 258-6151
Bonner, MT 59823
(406) 258-6151
Grades: PK-5
| 229 students
Rank: #22.
Bonner 6-8
(Math: 10-14% | Reading: 30-34%)
Rank:
Rank:
2/
Bottom 50%10
9045 Hwy 200 E
Bonner, MT 59823
(406) 258-6151
Bonner, MT 59823
(406) 258-6151
Grades: 6-8
| 109 students
Recent Articles

How Scaffolding Could Change the Way Your Child Learns
This article explores the concept of instructional scaffolding, a teaching method that enhances learning by breaking down complex tasks into manageable parts. It highlights how scaffolding supports students in developing critical thinking skills and becoming more independent learners. The article discusses the benefits of scaffolding, including improved engagement and reduced anxiety, and provides strategies for its implementation across various educational levels.

The Impact of Coronavirus on Public Schools
This article discusses the widespread impact of COVID-19 on public schools, addressing issues such as school closures, remote learning challenges, effects on standardized testing, and concerns about student progress. It also provides tips for parents suddenly faced with homeschooling responsibilities.

February 05, 2025
Understanding the U.S. Department of Education: Structure, Impact, and EvolutionWe explore how the Department of Education shapes American education, from its cabinet-level leadership to its impact on millions of students, written for general audiences seeking clarity on this vital institution.


