For the 2025 school year, there are 9 public preschools serving 3,814 students in Lyon School District. This district's average pre testing ranking is 3/10, which is in the bottom 50% of public pre schools in Nevada.
Public Preschools in Lyon School District have an average math proficiency score of 30% (versus the Nevada public pre school average of 32%), and reading proficiency score of 34% (versus the 41% statewide average).
Minority enrollment is 40% of the student body (majority Hispanic), which is less than the Nevada public preschool average of 75% (majority Hispanic).
Overview
This School District
This State (NV)
# Schools
22 Schools
371 Schools
# Students
9,057 Students
178,603 Students
# Teachers
458 Teachers
9,849 Teachers
Student : Teacher Ratio
20:1
20:1
District Rank
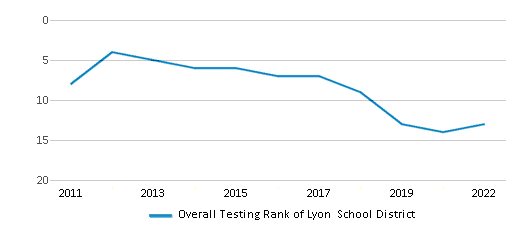
Lyon School District, which is ranked within the bottom 50% of all 20 school districts in Nevada (based off of combined math and reading proficiency testing data) for the 2021-2022 school year.
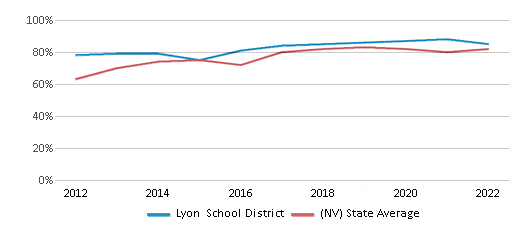
The school district's graduation rate of 85% has increased from 84% over five school years.
Overall District Rank
#13 out of 20 school districts
(Bottom 50%)
(Bottom 50%)
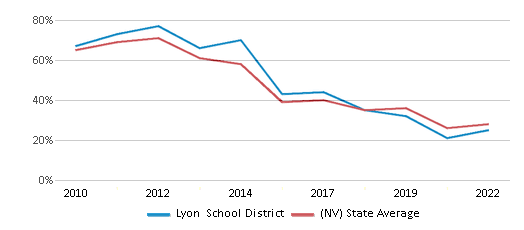
Math Test Scores (% Proficient)
25%
28%
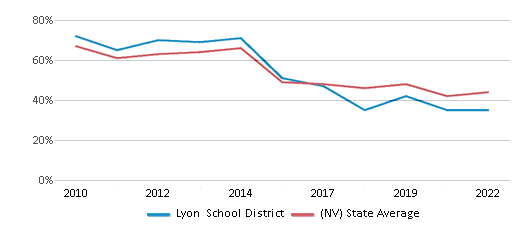
Reading/Language Arts Test Scores (% Proficient)
35%
44%
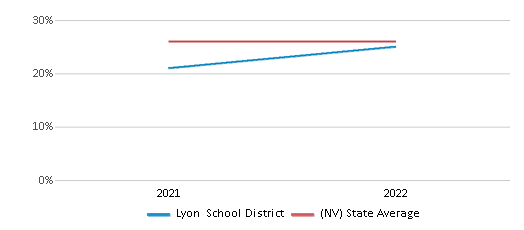
Science Test Scores (% Proficient)
25%
26%
Graduation Rate
85%
82%
Students by Ethnicity:
Diversity Score
0.58
0.70
# American Indian Students
289 Students
1,292 Students
% American Indian Students
3%
1%
# Asian Students
120 Students
8,295 Students
% Asian Students
1%
5%
# Hispanic Students
2,672 Students
83,559 Students
% Hispanic Students
30%
47%
# Black Students
85 Students
23,660 Students
% Black Students
1%
13%
# White Students
5,283 Students
45,147 Students
% White Students
58%
25%
# Hawaiian Students
77 Students
2,428 Students
% Hawaiian Students
1%
1%
# Two or more races Students
556 Students
14,182 Students
% of Two or more races Students
6%
8%
Students by Grade:
# Students in PK Grade:
101
13,681
# Students in K Grade:
563
22,667
# Students in 1st Grade:
627
26,161
# Students in 2nd Grade:
691
28,759
# Students in 3rd Grade:
697
27,536
# Students in 4th Grade:
680
28,547
# Students in 5th Grade:
711
28,012
# Students in 6th Grade:
655
878
# Students in 7th Grade:
712
597
# Students in 8th Grade:
709
575
# Students in 9th Grade:
735
354
# Students in 10th Grade:
750
304
# Students in 11th Grade:
762
257
# Students in 12th Grade:
642
186
# Ungraded Students:
22
89
District Revenue and Spending
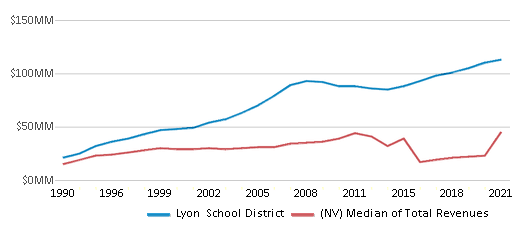
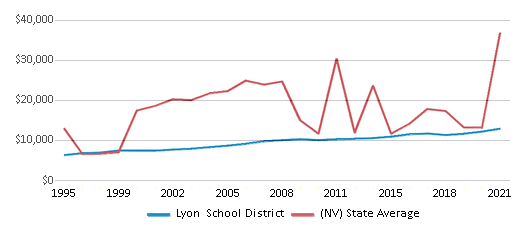
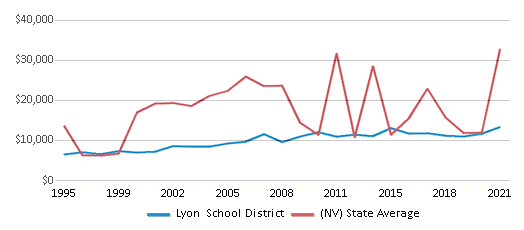
The revenue/student of $12,494 is higher than the state median of $12,085. The school district revenue/student has stayed relatively flat over four school years.
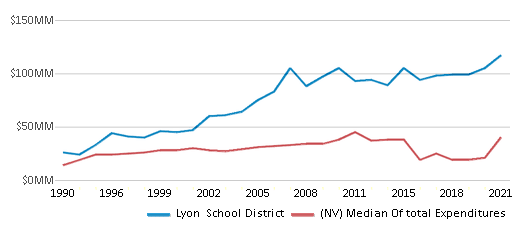
The school district's spending/student of $12,946 is higher than the state median of $12,248. The school district spending/student has stayed relatively flat over four school years.
Total Revenue
$113 MM
$5,795 MM
Spending
$117 MM
$5,873 MM
Revenue / Student
$12,494
$12,085
Spending / Student
$12,946
$12,248
Best Lyon School District Public Preschools (2025)
School
(Math and Reading Proficiency)
(Math and Reading Proficiency)
Location
Grades
Students
Rank: #11.
East Valley Elementary School
(Math: 40-44% | Reading: 45-49%)
Rank:
Rank:
8/
Top 30%10
4180 Farm District Road
Fernley, NV 89408
(775) 575-3332
Fernley, NV 89408
(775) 575-3332
Grades: PK-4
| 503 students
Rank: #22.
Sutro Elementary School
(Math: 34% | Reading: 39%)
Rank:
Rank:
6/
Top 50%10
190 Dayton Village Parkway
Dayton, NV 89403
(775) 246-6270
Dayton, NV 89403
(775) 246-6270
Grades: PK-6
| 416 students
Rank: #33.
Fernley Elementary School
(Math: 41% | Reading: 34%)
Rank:
Rank:
6/
Top 50%10
450 Hardie Lane
Fernley, NV 89408
(775) 575-3420
Fernley, NV 89408
(775) 575-3420
Grades: PK-4
| 421 students
Rank: #44.
Dayton Elementary School
(Math: 28% | Reading: 40%)
Rank:
Rank:
6/
Top 50%10
285 Dayton Valley Road
Dayton, NV 89403
(775) 246-6262
Dayton, NV 89403
(775) 246-6262
Grades: PK-6
| 454 students
Rank: #55.
Smith Valley Schools
(Math: 15-19% | Reading: 40-44%)
Rank:
Rank:
5/
Bottom 50%10
20 Day Lane
Smith, NV 89430
(775) 465-2332
Smith, NV 89430
(775) 465-2332
Grades: PK-12
| 189 students
Rank: #66.
Yerington Elementary School
(Math: 25-29% | Reading: 25-29%)
Rank:
Rank:
4/
Bottom 50%10
112 N. California Street
Yerington, NV 89447
(775) 463-6844
Yerington, NV 89447
(775) 463-6844
Grades: PK-4
| 466 students
Rank: #77.
Cottonwood Elementary School
(Math: 25% | Reading: 30%)
Rank:
Rank:
4/
Bottom 50%10
925 Farm District Road
Fernley, NV 89408
(775) 575-3414
Fernley, NV 89408
(775) 575-3414
Grades: PK-4
| 575 students
Rank: #88.
Riverview Elementary School
(Math: 24% | Reading: 28%)
Rank:
Rank:
4/
Bottom 50%10
1200 Ferretto Parkway
Dayton, NV 89403
(775) 246-6170
Dayton, NV 89403
(775) 246-6170
Grades: PK-6
| 435 students
Rank: #99.
Silver Stage Elementary School
(Math: 25-29% | Reading: 20-24%)
Rank:
Rank:
4/
Bottom 50%10
3900 W. Spruce Avenue
Silver Springs, NV 89429
(775) 577-5060
Silver Springs, NV 89429
(775) 577-5060
Grades: PK-4
| 355 students
Recent Articles

What Is A Charter School?
Explore the world of charter schools in this comprehensive guide. Learn about their history, how they operate, and the pros and cons of this educational innovation. Discover key facts about charter schools, including admission policies, demographics, and funding, as well as what to look for when considering a charter school for your child.

10 Reasons Why High School Sports Benefit Students
Discover the 10 compelling reasons why high school sports are beneficial for students. This comprehensive article explores how athletics enhance academic performance, foster personal growth, and develop crucial life skills. From improved fitness and time management to leadership development and community representation, learn why participating in high school sports can be a game-changer for students' overall success and well-being.

February 05, 2025
Understanding the U.S. Department of Education: Structure, Impact, and EvolutionWe explore how the Department of Education shapes American education, from its cabinet-level leadership to its impact on millions of students, written for general audiences seeking clarity on this vital institution.


