Top Rankings
Catawba County Schools School District ranks among the top 20% of public school district in North Carolina for:
Category
Attribute
Community Size
Largest student body (number of students) (Top 1%)
For the 2025 school year, there are 28 public schools serving 15,880 students in Catawba County Schools School District. This district's average testing ranking is 7/10, which is in the top 50% of public schools in North Carolina.
Public Schools in Catawba County Schools School District have an average math proficiency score of 58% (versus the North Carolina public school average of 51%), and reading proficiency score of 51% (versus the 50% statewide average).
Minority enrollment is 40% of the student body (majority Hispanic), which is less than the North Carolina public school average of 57% (majority Black and Hispanic).
Overview
This School District
This State (NC)
# Schools
28 Schools
2,764 Schools
# Students
15,880 Students
1,547,014 Students
# Teachers
1,007 Teachers
100,085 Teachers
Student : Teacher Ratio
16:1
16:1
District Rank
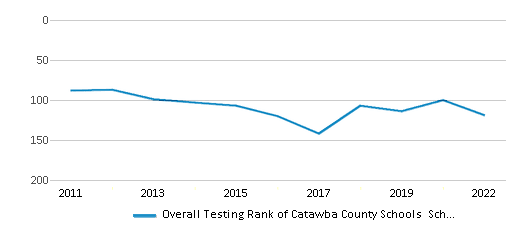
Catawba County Schools School District, which is ranked within the top 50% of all 320 school districts in North Carolina (based off of combined math and reading proficiency testing data) for the 2021-2022 school year.
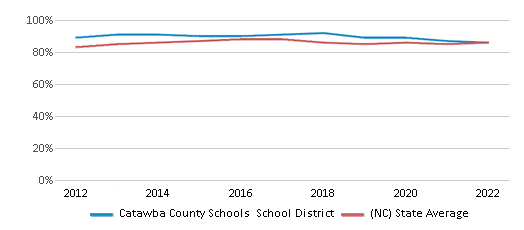
The school district's graduation rate of 86% has decreased from 91% over five school years.
Overall District Rank
#119 out of 325 school districts
(Top 50%)
(Top 50%)
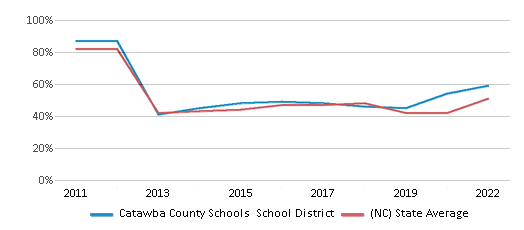
Math Test Scores (% Proficient)
59%
51%
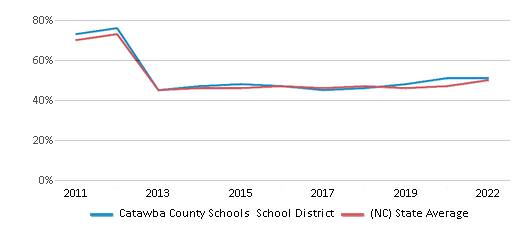
Reading/Language Arts Test Scores (% Proficient)
51%
50%
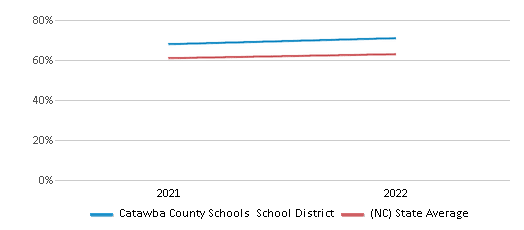
Science Test Scores (% Proficient)
71%
63%
Graduation Rate
86%
86%
Students by Ethnicity:
Diversity Score
0.60
0.71
# American Indian Students
6 Students
16,971 Students
% American Indian Students
n/a
1%
# Asian Students
1,195 Students
65,132 Students
% Asian Students
7%
4%
# Hispanic Students
3,000 Students
326,941 Students
% Hispanic Students
19%
21%
# Black Students
916 Students
380,120 Students
% Black Students
6%
25%
# White Students
9,530 Students
665,292 Students
% White Students
60%
43%
# Hawaiian Students
9 Students
2,147 Students
% Hawaiian Students
n/a
n/a
# Two or more races Students
1,224 Students
92,182 Students
% of Two or more races Students
8%
6%
Students by Grade:
# Students in PK Grade:
251
23,648
# Students in K Grade:
1,086
110,403
# Students in 1st Grade:
1,109
114,331
# Students in 2nd Grade:
1,194
118,121
# Students in 3rd Grade:
1,112
111,941
# Students in 4th Grade:
1,154
114,493
# Students in 5th Grade:
1,137
115,565
# Students in 6th Grade:
1,264
116,023
# Students in 7th Grade:
1,156
116,793
# Students in 8th Grade:
1,183
119,029
# Students in 9th Grade:
1,413
137,977
# Students in 10th Grade:
1,362
126,349
# Students in 11th Grade:
1,299
117,582
# Students in 12th Grade:
1,160
104,759
# Ungraded Students:
-
-
District Revenue and Spending
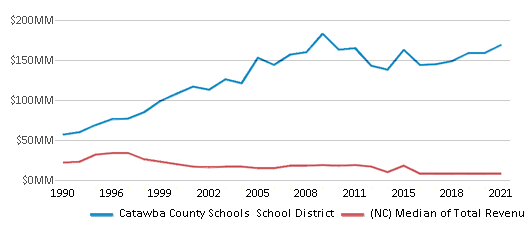
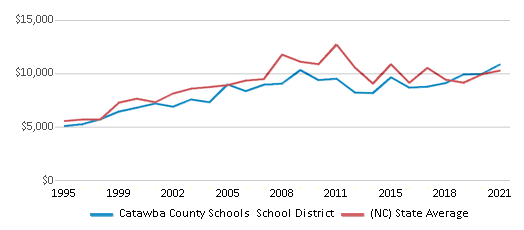
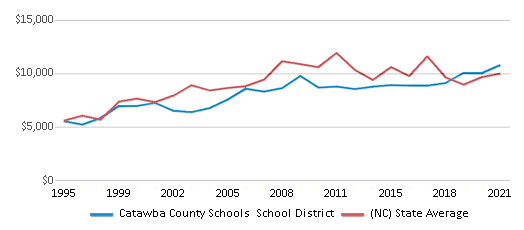
The revenue/student of $10,638 in this school district is less than the state median of $11,187. The school district revenue/student has stayed relatively flat over four school years.
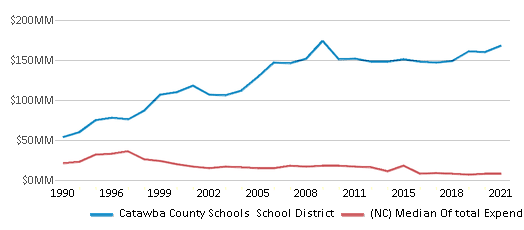
The school district's spending/student of $10,571 is less than the state median of $11,612. The school district spending/student has stayed relatively flat over four school years.
Total Revenue
$169 MM
$17,307 MM
Spending
$168 MM
$17,964 MM
Revenue / Student
$10,638
$11,187
Spending / Student
$10,571
$11,612
Best Catawba County Schools School District Public Schools (2025)
School
(Math and Reading Proficiency)
(Math and Reading Proficiency)
Location
Grades
Students
Rank: #11.
Bandys High School
(Math: 85-89% | Reading: 69%)
Rank:
Rank:
10/
Top 10%10
5040 E Bandys Road
Catawba, NC 28609
(828) 241-1471
Catawba, NC 28609
(828) 241-1471
Grades: 9-12
| 923 students
Rank: #22.
Sherrills Ford Elementary School
(Math: 79% | Reading: 67%)
Rank:
Rank:
9/
Top 20%10
8103 Sherrills Ford Road
Sherrills Ford, NC 28673
(828) 478-2662
Sherrills Ford, NC 28673
(828) 478-2662
Grades: K-6
| 578 students
Rank: #33.
Fred T Foard High School
(Math: 75-79% | Reading: 63%)
Rank:
Rank:
9/
Top 20%10
3407 Plateau Road
Newton, NC 28658
(704) 462-1496
Newton, NC 28658
(704) 462-1496
Grades: 9-12
| 956 students
Rank: #44.
Mountain View Elementary School
(Math: 72% | Reading: 62%)
Rank:
Rank:
9/
Top 20%10
5911 Dwayne Starnes Road
Hickory, NC 28602
(828) 294-2020
Hickory, NC 28602
(828) 294-2020
Grades: K-6
| 713 students
Rank: #55.
Maiden High School
(Math: 75-79% | Reading: 59%)
Rank:
Rank:
9/
Top 20%10
600 West Main Street
Maiden, NC 28650
(828) 428-8197
Maiden, NC 28650
(828) 428-8197
Grades: 9-12
| 879 students
Rank: #66.
Saint Stephens High School
(Math: 75-79% | Reading: 54%)
Rank:
Rank:
8/
Top 30%10
3205 34th Street Drive Ne
Hickory, NC 28601
(828) 256-9841
Hickory, NC 28601
(828) 256-9841
Grades: 9-12
| 1,298 students
Rank: #77.
Clyde Campbell Elementary School
(Math: 69% | Reading: 58%)
Rank:
Rank:
8/
Top 30%10
2121 35th Avenue Drive Ne
Hickory, NC 28601
(828) 256-2769
Hickory, NC 28601
(828) 256-2769
Grades: PK-6
| 501 students
Rank: #88.
Bunker Hill High School
(Math: 75-79% | Reading: 50-54%)
Rank:
Rank:
8/
Top 30%10
4675 Oxford School Road
Claremont, NC 28610
(828) 241-3355
Claremont, NC 28610
(828) 241-3355
Grades: 9-12
| 883 students
Rank: #99.
Snow Creek Elementary School
(Math: 67% | Reading: 58%)
Rank:
Rank:
8/
Top 30%10
3238 Snow Creek Rd
Hickory, NC 28601
(828) 256-2335
Hickory, NC 28601
(828) 256-2335
Grades: PK-6
| 569 students
Rank: #1010.
Challenger Early College High School
(Math: ≥50% | Reading: ≥95%)
Rank:
Rank:
8/
Top 30%10
2550 Hwy 70 Se
Hickory, NC 28602
(828) 485-2980
Hickory, NC 28602
(828) 485-2980
Grades: 9-12
| 362 students
Rank: #1111.
Jacobs Fork Middle School
(Math: 60% | Reading: 60%)
Rank:
Rank:
8/
Top 30%10
3431 Plateau Road
Newton, NC 28658
(704) 462-1827
Newton, NC 28658
(704) 462-1827
Grades: 7-8
| 443 students
Rank: #1212.
Balls Creek Elementary School
(Math: 71% | Reading: 51%)
Rank:
Rank:
8/
Top 30%10
2620 Balls Creek Road
Newton, NC 28658
(828) 464-4766
Newton, NC 28658
(828) 464-4766
Grades: PK-6
| 698 students
Rank: #1313.
Mill Creek Middle School
(Math: 60% | Reading: 54%)
Rank:
Rank:
7/
Top 50%10
1041 Shiloh Road
Claremont, NC 28610
(828) 241-1494
Claremont, NC 28610
(828) 241-1494
Grades: 7-8
| 421 students
Rank: #1414.
Maiden Middle School
(Math: 57% | Reading: 54%)
Rank:
Rank:
7/
Top 50%10
518 North C Avenue
Maiden, NC 28650
(828) 428-2326
Maiden, NC 28650
(828) 428-2326
Grades: 7-8
| 405 students
Rank: #1515.
Startown Elementary School
(Math: 57% | Reading: 50%)
Rank:
Rank:
6/
Top 50%10
4119 Startown Road
Newton, NC 28658
(828) 464-1257
Newton, NC 28658
(828) 464-1257
Grades: PK-6
| 534 students
Rank: #1616.
Blackburn Elementary School
(Math: 59% | Reading: 48%)
Rank:
Rank:
6/
Top 50%10
4377 W Nc 10 Hwy
Newton, NC 28658
(704) 462-1344
Newton, NC 28658
(704) 462-1344
Grades: K-6
| 488 students
Rank: #1717.
Harry M Arndt Middle School
(Math: 56% | Reading: 50%)
Rank:
Rank:
6/
Top 50%10
3350 34th Street Drive Ne
Hickory, NC 28601
(828) 256-9545
Hickory, NC 28601
(828) 256-9545
Grades: 7-8
| 628 students
Rank: #1818.
Charles H Tuttle Elementary School
(Math: 59% | Reading: 45%)
Rank:
Rank:
6/
Top 50%10
2872 Water Plant Road
Maiden, NC 28650
(828) 428-3080
Maiden, NC 28650
(828) 428-3080
Grades: K-6
| 384 students
Rank: #1919.
Maiden Elementary School
(Math: 54% | Reading: 43%)
Rank:
Rank:
5/
Bottom 50%10
201 N Main Avenue
Maiden, NC 28650
(828) 428-8769
Maiden, NC 28650
(828) 428-8769
Grades: PK-6
| 538 students
Rank: #2020.
Claremont Elementary School
(Math: 53% | Reading: 43%)
Rank:
Rank:
5/
Bottom 50%10
3384 E Main Street
Claremont, NC 28610
(828) 459-7921
Claremont, NC 28610
(828) 459-7921
Grades: PK-6
| 440 students
Rank: #2121.
Banoak Elementary School
(Math: 50-54% | Reading: 40-44%)
Rank:
Rank:
5/
Bottom 50%10
7651 W Nc 10 Hwy
Vale, NC 28168
(704) 462-2849
Vale, NC 28168
(704) 462-2849
Grades: K-6
| 271 students
Rank: #2222.
River Bend Middle School
(Math: 46% | Reading: 45%)
Rank:
Rank:
5/
Bottom 50%10
4670 Oxford School Road
Claremont, NC 28610
(828) 241-2754
Claremont, NC 28610
(828) 241-2754
Grades: 7-8
| 442 students
Rank: #2323.
Catawba Elementary School
(Math: 54% | Reading: 36%)
Rank:
Rank:
4/
Bottom 50%10
5415 Hudson Chapel Road
Catawba, NC 28609
(828) 241-3131
Catawba, NC 28609
(828) 241-3131
Grades: PK-6
| 421 students
Rank: #2424.
Lyle Creek Elementary School
(Math: 50% | Reading: 35%)
Rank:
Rank:
4/
Bottom 50%10
1845 Edgewater Drive Nw
Conover, NC 28613
(828) 464-0299
Conover, NC 28613
(828) 464-0299
Grades: PK-6
| 444 students
Rank: #2525.
Oxford Elementary School
(Math: 45% | Reading: 38%)
Rank:
Rank:
4/
Bottom 50%10
5915 Oxford School Road
Claremont, NC 28610
(828) 459-7220
Claremont, NC 28610
(828) 459-7220
Grades: PK-6
| 547 students
Rank: #2626.
Webb A Murray Elementary School
(Math: 44% | Reading: 33%)
Rank:
Rank:
3/
Bottom 50%10
3901 Section House Road
Hickory, NC 28601
(828) 256-2196
Hickory, NC 28601
(828) 256-2196
Grades: PK-6
| 384 students
Rank: #2727.
Saint Stephens Elementary School
(Math: 36% | Reading: 29%)
Rank:
Rank:
2/
Bottom 50%10
684 30th Street Ne
Conover, NC 28613
(828) 256-2570
Conover, NC 28613
(828) 256-2570
Grades: K-6
| 730 students
Rank: #2828.
Catawba Rosenwald Education Center
Special Education School
(Math: ≤10% | Reading: ≤10% )
Rank:
Rank:
1/
Bottom 50%10
403 6th Ave Sw
Catawba, NC 28609
(828) 241-2734
Catawba, NC 28609
(828) 241-2734
Grades: K-12
| n/a students
Frequently Asked Questions
How many schools belong to Catawba County Schools School District?
Catawba County Schools School District manages 28 public schools serving 15,880 students.
What is the rank of Catawba County Schools School District?
Catawba County Schools School District is ranked #125 out of 320 school districts in North Carolina (top 50%) based off of combined math and reading proficiency testing data for the 2021-2022 school year. This district ranks in the top 20% of North Carolina school districts for: Largest student body (number of students) (Top 1%)
What is the racial composition of students in Catawba County Schools School District?
60% of Catawba County Schools School District students are White, 19% of students are Hispanic, 8% of students are Two or more races, 7% of students are Asian, and 6% of students are Black.
What is the student/teacher ratio of Catawba County Schools School District?
Catawba County Schools School District has a student/teacher ratio of 16:1, which is higher than the North Carolina state average of 15:1.
What is Catawba County Schools School District's spending/student ratio?
The school district's spending/student of $10,571 is less than the state median of $11,612. The school district spending/student has stayed relatively flat over four school years.
Recent Articles

What Is A Charter School?
Explore the world of charter schools in this comprehensive guide. Learn about their history, how they operate, and the pros and cons of this educational innovation. Discover key facts about charter schools, including admission policies, demographics, and funding, as well as what to look for when considering a charter school for your child.

10 Reasons Why High School Sports Benefit Students
Discover the 10 compelling reasons why high school sports are beneficial for students. This comprehensive article explores how athletics enhance academic performance, foster personal growth, and develop crucial life skills. From improved fitness and time management to leadership development and community representation, learn why participating in high school sports can be a game-changer for students' overall success and well-being.

February 05, 2025
Understanding the U.S. Department of Education: Structure, Impact, and EvolutionWe explore how the Department of Education shapes American education, from its cabinet-level leadership to its impact on millions of students, written for general audiences seeking clarity on this vital institution.


