Top Rankings
Nash County School District ranks among the top 20% of public school district in North Carolina for:
Category
Attribute
Community Size
Largest student body (number of students) (Top 1%)
For the 2025 school year, there are 28 public schools serving 14,476 students in Nash County School District. This district's average testing ranking is 2/10, which is in the bottom 50% of public schools in North Carolina.
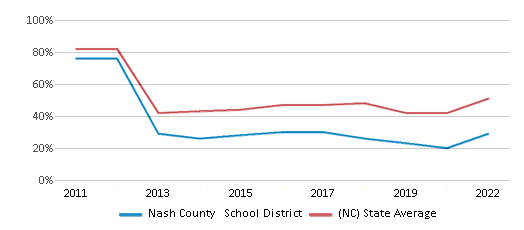
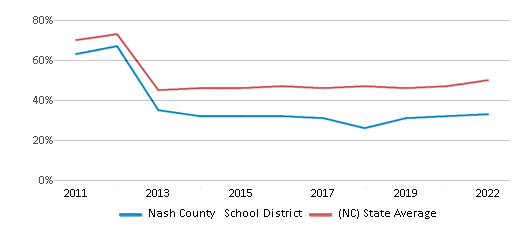
Public Schools in Nash County School District have an average math proficiency score of 29% (versus the North Carolina public school average of 51%), and reading proficiency score of 33% (versus the 50% statewide average).
Minority enrollment is 74% of the student body (majority Black), which is more than the North Carolina public school average of 57% (majority Black and Hispanic).
Overview
This School District
This State (NC)
# Schools
28 Schools
2,764 Schools
# Students
14,476 Students
1,547,014 Students
# Teachers
846 Teachers
100,085 Teachers
Student : Teacher Ratio
17:1
17:1
District Rank
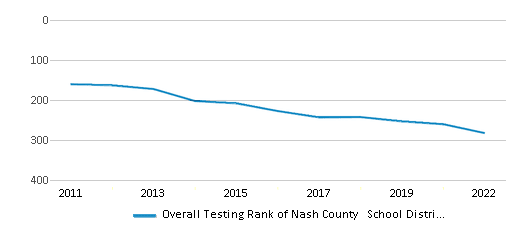
Nash County School District, which is ranked within the bottom 50% of all 320 school districts in North Carolina (based off of combined math and reading proficiency testing data) for the 2021-2022 school year.
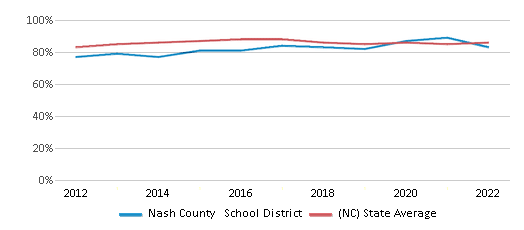
The school district's graduation rate of 83% has decreased from 84% over five school years.
Overall District Rank
#282 out of 325 school districts
(Bottom 50%)
(Bottom 50%)
Math Test Scores (% Proficient)
29%
51%
Reading/Language Arts Test Scores (% Proficient)
33%
50%
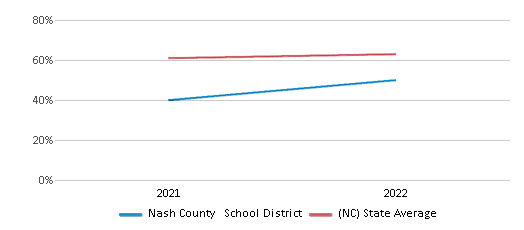
Science Test Scores (% Proficient)
50%
63%
Graduation Rate
83%
86%
Students by Ethnicity:
Diversity Score
0.64
0.71
# American Indian Students
75 Students
16,971 Students
% American Indian Students
n/a
1%
# Asian Students
126 Students
65,132 Students
% Asian Students
1%
4%
# Hispanic Students
2,317 Students
326,941 Students
% Hispanic Students
16%
21%
# Black Students
7,552 Students
380,120 Students
% Black Students
52%
25%
# White Students
3,724 Students
665,292 Students
% White Students
26%
43%
# Hawaiian Students
5 Students
2,147 Students
% Hawaiian Students
n/a
n/a
# Two or more races Students
769 Students
92,182 Students
% of Two or more races Students
5%
6%
Students by Grade:
# Students in PK Grade:
250
23,648
# Students in K Grade:
1,078
110,403
# Students in 1st Grade:
1,060
114,331
# Students in 2nd Grade:
1,128
118,121
# Students in 3rd Grade:
983
111,941
# Students in 4th Grade:
1,035
114,493
# Students in 5th Grade:
1,066
115,565
# Students in 6th Grade:
1,096
116,023
# Students in 7th Grade:
1,096
116,793
# Students in 8th Grade:
1,139
119,029
# Students in 9th Grade:
1,221
137,977
# Students in 10th Grade:
1,194
126,349
# Students in 11th Grade:
1,149
117,582
# Students in 12th Grade:
981
104,759
# Ungraded Students:
-
-
District Revenue and Spending
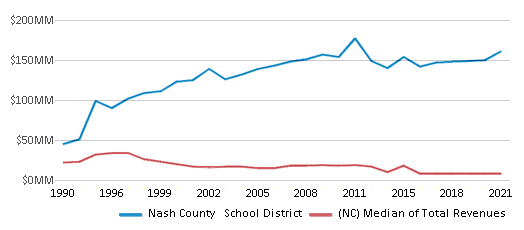
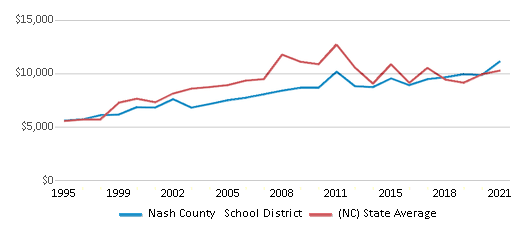
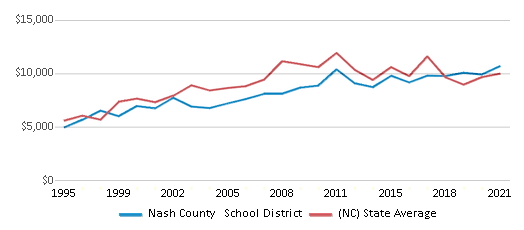
The revenue/student of $11,099 in this school district is less than the state median of $11,187. The school district revenue/student has stayed relatively flat over four school years.
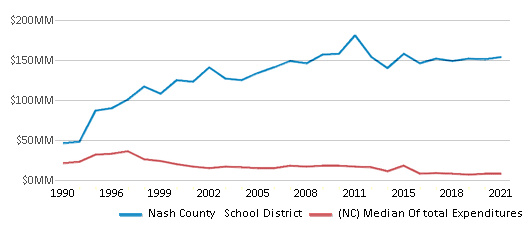
The school district's spending/student of $10,651 is less than the state median of $11,612. The school district spending/student has stayed relatively flat over four school years.
Total Revenue
$161 MM
$17,307 MM
Spending
$154 MM
$17,964 MM
Revenue / Student
$11,099
$11,187
Spending / Student
$10,651
$11,612
Best Nash County School District Public Schools (2025)
School
(Math and Reading Proficiency)
(Math and Reading Proficiency)
Location
Grades
Students
Rank: #11.
Nrm Early College High School
(Math: 75-79% | Reading: 85-89%)
Rank:
Rank:
10/
Top 5%10
530 North Old Carriage Road
Rocky Mount, NC 27804
(252) 451-2890
Rocky Mount, NC 27804
(252) 451-2890
Grades: 9-13
| 327 students
Rank: #22.
Citi High School
(Math: 60-79% | Reading: 60-79%)
Rank:
Rank:
9/
Top 20%10
846 Hammond St
Rocky Mount, NC 27804
(252) 462-2842
Rocky Mount, NC 27804
(252) 462-2842
Grades: 9-13
| 82 students
Rank: #33.
Coopers Elementary School
(Math: 59% | Reading: 50%)
Rank:
Rank:
7/
Top 50%10
6833 Nc Highway 58
Elm City, NC 27822
(252) 937-9035
Elm City, NC 27822
(252) 937-9035
Grades: PK-5
| 618 students
Rank: #44.
Southern Nash High School
(Math: 50-59% | Reading: 43%)
Rank:
Rank:
5/
Bottom 50%10
6446 Southern Nash High Road
Bailey, NC 27807
(252) 451-8520
Bailey, NC 27807
(252) 451-8520
Grades: 9-12
| 1,073 students
Rank: #55.
Bailey Elementary School
(Math: 45% | Reading: 39%)
Rank:
Rank:
4/
Bottom 50%10
6288 Pine Street
Bailey, NC 27807
(252) 451-2892
Bailey, NC 27807
(252) 451-2892
Grades: PK-5
| 569 students
Rank: #66.
Northern Nash High School
(Math: 40-44% | Reading: 38%)
Rank:
Rank:
4/
Bottom 50%10
4230 Green Hills Road
Rocky Mount, NC 27804
(252) 937-9040
Rocky Mount, NC 27804
(252) 937-9040
Grades: 9-12
| 1,029 students
Rank: #77.
Tar River Academy
Alternative School
(Math: 21% | Reading: 49%)
Rank:
Rank:
3/
Bottom 50%10
906 Hammond Street
Rocky Mount, NC 27804
(252) 451-2875
Rocky Mount, NC 27804
(252) 451-2875
Grades: 9-12
| 67 students
Rank: #88.
Nashville Elementary School
(Math: 40% | Reading: 34%)
Rank:
Rank:
3/
Bottom 50%10
209 East Virginia Avenue
Nashville, NC 27856
(252) 451-2877
Nashville, NC 27856
(252) 451-2877
Grades: PK-5
| 661 students
Rank: #99.
Nash Central Middle School
(Math: 34% | Reading: 37%)
Rank:
Rank:
3/
Bottom 50%10
1638 South First Street
Nashville, NC 27856
(252) 937-9065
Nashville, NC 27856
(252) 937-9065
Grades: 6-8
| 525 students
Rank: #1010.
Middlesex Elementary School
(Math: 35-39% | Reading: 30-34%)
Rank:
Rank:
3/
Bottom 50%10
13081 West Hanes Avenue
Middlesex, NC 27557
(252) 462-2815
Middlesex, NC 27557
(252) 462-2815
Grades: PK-5
| 353 students
Rank: #1111.
Rocky Mount High School
(Math: 20-24% | Reading: 39%)
Rank:
Rank:
2/
Bottom 50%10
1400 Bethlehem Road
Rocky Mount, NC 27803
(252) 937-9050
Rocky Mount, NC 27803
(252) 937-9050
Grades: 9-12
| 997 students
Rank: #1212.
Red Oak Middle School
(Math: 29% | Reading: 35%)
Rank:
Rank:
2/
Bottom 50%10
3170 Red Oak-battleboro Road
Battleboro, NC 27809
(252) 462-2000
Battleboro, NC 27809
(252) 462-2000
Grades: 6-8
| 808 students
Rank: #1313.
Southern Nash Middle School
(Math: 31% | Reading: 33%)
Rank:
Rank:
2/
Bottom 50%10
5301 South Nc Highway 581
Spring Hope, NC 27882
(252) 937-9020
Spring Hope, NC 27882
(252) 937-9020
Grades: 6-8
| 782 students
Rank: #1414.
M B Hubbard Elementary School
(Math: 27% | Reading: 32%)
Rank:
Rank:
2/
Bottom 50%10
7921 Red Oak Battleboro Road
Battleboro, NC 27809
(252) 451-8515
Battleboro, NC 27809
(252) 451-8515
Grades: K-5
| 411 students
Rank: #1515.
Englewood Elementary School
(Math: 30% | Reading: 29%)
Rank:
Rank:
2/
Bottom 50%10
101 South Englewood Drive
Rocky Mount, NC 27804
(252) 462-2501
Rocky Mount, NC 27804
(252) 462-2501
Grades: 3-5
| 547 students
Rank: #1616.
Benvenue Elementary School
(Math: 28% | Reading: 28%)
Rank:
Rank:
2/
Bottom 50%10
2700 Nicodemus Mile Road
Rocky Mount, NC 27804
(252) 462-2835
Rocky Mount, NC 27804
(252) 462-2835
Grades: K-5
| 613 students
Rank: #1717.
G R Edwards Middle School
(Math: 26% | Reading: 30%)
Rank:
Rank:
2/
Bottom 50%10
720 Edwards Street
Rocky Mount, NC 27803
(252) 937-9025
Rocky Mount, NC 27803
(252) 937-9025
Grades: 6-8
| 432 students
Rank: #1818.
Spring Hope Elementary School
(Math: 25-29% | Reading: 25-29%)
Rank:
Rank:
2/
Bottom 50%10
401 Mclean Street
Spring Hope, NC 27882
(252) 451-8530
Spring Hope, NC 27882
(252) 451-8530
Grades: PK-5
| 362 students
Rank: #1919.
Nash Central High School
(Math: 10-14% | Reading: 34%)
Rank:
Rank:
1/
Bottom 50%10
4279 Nash Central High Road
Rocky Mount, NC 27804
(252) 451-2860
Rocky Mount, NC 27804
(252) 451-2860
Grades: 9-12
| 900 students
Rank: #2020.
Rocky Mount Middle School
(Math: 15% | Reading: 28%)
Rank:
Rank:
1/
Bottom 50%10
841 Nash Street
Rocky Mount, NC 27804
(252) 462-2010
Rocky Mount, NC 27804
(252) 462-2010
Grades: 6-8
| 448 students
Rank: #2121.
Williford Elementary School
(Math: 13% | Reading: 14% )
Rank:
Rank:
1/
Bottom 50%10
801 Williford Street
Rocky Mount, NC 27803
(252) 937-9030
Rocky Mount, NC 27803
(252) 937-9030
Grades: PK-2
| 253 students
Rank: #2222.
Baskerville Elementary School
(Math: 6-9% | Reading: 15-19%)
Rank:
Rank:
1/
Bottom 50%10
1100 Stokes Avenue
Rocky Mount, NC 27801
(252) 451-2880
Rocky Mount, NC 27801
(252) 451-2880
Grades: K-5
| 321 students
Rank: #2323.
D S Johnson Elementary School
(Math: 9% | Reading: 13%)
Rank:
Rank:
1/
Bottom 50%10
600 North Fairview Road
Rocky Mount, NC 27801
(252) 451-2895
Rocky Mount, NC 27801
(252) 451-2895
Grades: 3-5
| 332 students
Rank: #2424.
J W Parker Middle School
(Math: 5% | Reading: 14%)
Rank:
Rank:
1/
Bottom 50%10
1500 East Virginia Street
Rocky Mount, NC 27801
(252) 937-9060
Rocky Mount, NC 27801
(252) 937-9060
Grades: 6-8
| 244 students
Rank: n/an/a
720 N Fairview Rd
Rocky Mount, NC 27801
(252) 462-2005
Rocky Mount, NC 27801
(252) 462-2005
Grades: K-2
| 259 students
Rank: n/an/a
801 Williford St
Rocky Mount, NC 27803
(252) 462-2855
Rocky Mount, NC 27803
(252) 462-2855
Grades: 1-12
| 238 students
Rank: n/an/a
5603 Red Oak Road
Red Oak, NC 27868
(252) 462-2496
Red Oak, NC 27868
(252) 462-2496
Grades: PK-5
| 687 students
Rank: n/an/a
991 South Winstead Avenue
Rocky Mount, NC 27804
(252) 462-2845
Rocky Mount, NC 27804
(252) 462-2845
Grades: K-2
| 538 students
Frequently Asked Questions
How many schools belong to Nash County School District?
Nash County School District manages 28 public schools serving 14,476 students.
What is the rank of Nash County School District?
Nash County School District is ranked #284 out of 320 school districts in North Carolina (bottom 50%) based off of combined math and reading proficiency testing data for the 2021-2022 school year. This district ranks in the top 20% of North Carolina school districts for: Largest student body (number of students) (Top 1%)
What is the racial composition of students in Nash County School District?
52% of Nash County School District students are Black, 26% of students are White, 16% of students are Hispanic, 5% of students are Two or more races, and 1% of students are Asian.
What is the student/teacher ratio of Nash County School District?
Nash County School District has a student/teacher ratio of 17:1, which is higher than the North Carolina state average of 15:1.
What is Nash County School District's spending/student ratio?
The school district's spending/student of $10,651 is less than the state median of $11,612. The school district spending/student has stayed relatively flat over four school years.
Recent Articles

What Is A Charter School?
Explore the world of charter schools in this comprehensive guide. Learn about their history, how they operate, and the pros and cons of this educational innovation. Discover key facts about charter schools, including admission policies, demographics, and funding, as well as what to look for when considering a charter school for your child.

10 Reasons Why High School Sports Benefit Students
Discover the 10 compelling reasons why high school sports are beneficial for students. This comprehensive article explores how athletics enhance academic performance, foster personal growth, and develop crucial life skills. From improved fitness and time management to leadership development and community representation, learn why participating in high school sports can be a game-changer for students' overall success and well-being.

February 05, 2025
Understanding the U.S. Department of Education: Structure, Impact, and EvolutionWe explore how the Department of Education shapes American education, from its cabinet-level leadership to its impact on millions of students, written for general audiences seeking clarity on this vital institution.


