Top Rankings
New Hanover County Schools School District ranks among the top 20% of public school district in North Carolina for:
Category
Attribute
Community Size
Largest student body (number of students) (Top 1%)
For the 2025 school year, there are 35 public elementary schools serving 16,418 students in New Hanover County Schools School District. This district's average elementary testing ranking is 7/10, which is in the top 50% of public elementary schools in North Carolina.
Public Elementary Schools in New Hanover County Schools School District have an average math proficiency score of 56% (versus the North Carolina public elementary school average of 50%), and reading proficiency score of 53% (versus the 49% statewide average).
Minority enrollment is 44% of the student body (majority Hispanic), which is less than the North Carolina public elementary school average of 57% (majority Black and Hispanic).
Overview
This School District
This State (NC)
# Schools
43 Schools
2,174 Schools
# Students
24,978 Students
1,091,007 Students
# Teachers
1,682 Teachers
73,903 Teachers
Student : Teacher Ratio
15:1
15:1
District Rank
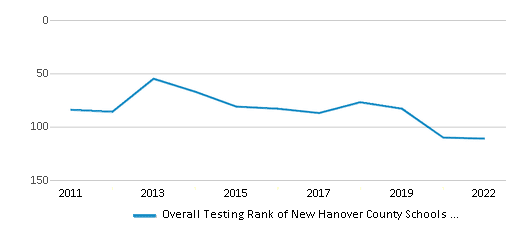
New Hanover County Schools School District, which is ranked within the top 50% of all 320 school districts in North Carolina (based off of combined math and reading proficiency testing data) for the 2021-2022 school year.
The school district's graduation rate of 89% has increased from 83% over five school years.
Overall District Rank
#111 out of 325 school districts
(Top 50%)
(Top 50%)
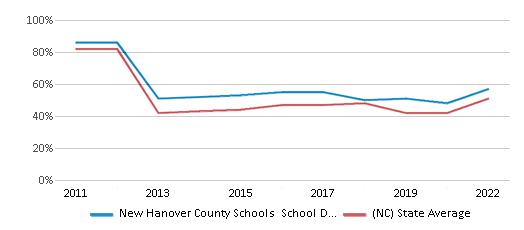
Math Test Scores (% Proficient)
57%
51%
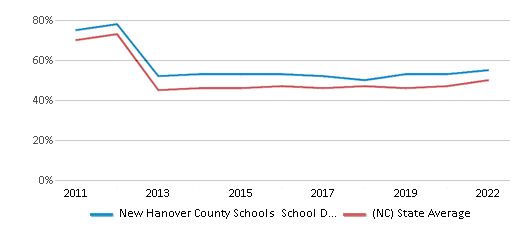
Reading/Language Arts Test Scores (% Proficient)
55%
50%
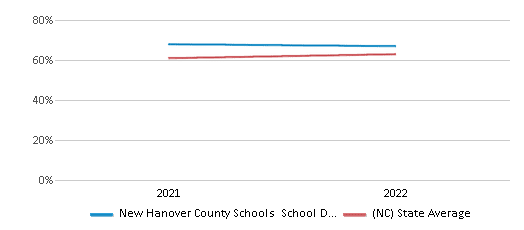
Science Test Scores (% Proficient)
67%
63%
Graduation Rate
89%
86%
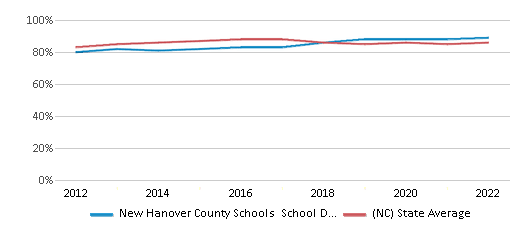
Students by Ethnicity:
Diversity Score
0.61
0.72
# American Indian Students
68 Students
12,383 Students
% American Indian Students
n/a
1%
# Asian Students
439 Students
47,310 Students
% Asian Students
2%
4%
# Hispanic Students
4,790 Students
227,576 Students
% Hispanic Students
19%
21%
# Black Students
4,036 Students
268,051 Students
% Black Students
16%
25%
# White Students
14,322 Students
465,086 Students
% White Students
57%
43%
# Hawaiian Students
37 Students
1,488 Students
% Hawaiian Students
n/a
n/a
# Two or more races Students
1,336 Students
69,126 Students
% of Two or more races Students
6%
6%
Students by Grade:
# Students in PK Grade:
147
23,192
# Students in K Grade:
1,696
109,971
# Students in 1st Grade:
1,856
114,331
# Students in 2nd Grade:
1,892
118,121
# Students in 3rd Grade:
1,828
111,941
# Students in 4th Grade:
1,812
114,493
# Students in 5th Grade:
1,848
115,565
# Students in 6th Grade:
1,722
116,023
# Students in 7th Grade:
1,763
113,393
# Students in 8th Grade:
1,757
115,504
# Students in 9th Grade:
2,389
11,612
# Students in 10th Grade:
2,151
10,182
# Students in 11th Grade:
2,234
8,704
# Students in 12th Grade:
1,883
7,975
# Ungraded Students:
-
-
District Revenue and Spending
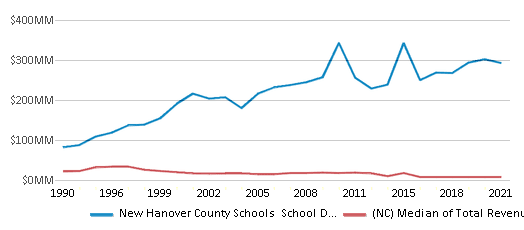
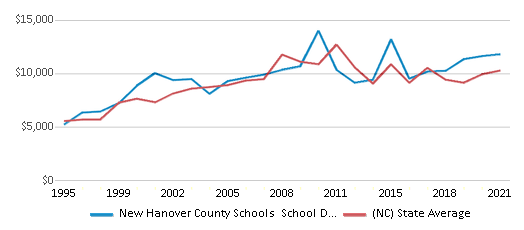
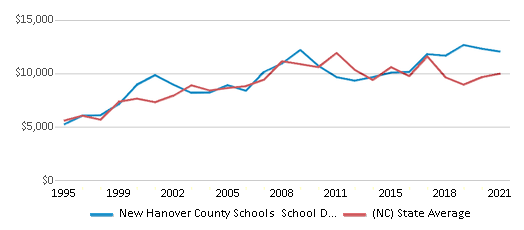
The revenue/student of $11,729 is higher than the state median of $11,187. The school district revenue/student has stayed relatively flat over four school years.
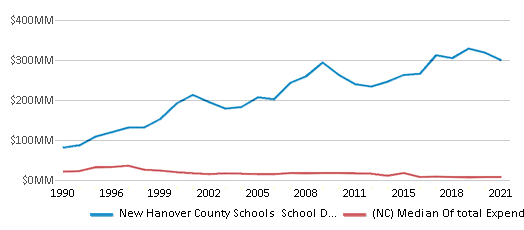
The school district's spending/student of $11,991 is higher than the state median of $11,612. The school district spending/student has stayed relatively flat over four school years.
Total Revenue
$293 MM
$17,307 MM
Spending
$300 MM
$17,964 MM
Revenue / Student
$11,729
$11,187
Spending / Student
$11,991
$11,612
Best New Hanover County Schools School District Public Elementary Schools (2025)
School
(Math and Reading Proficiency)
(Math and Reading Proficiency)
Location
Grades
Students
Rank: #11.
Wrightsville Beach Elementary School
(Math: 90-94% | Reading: 85-89%)
Rank:
Rank:
10/
Top 5%10
220 Coral Drive
Wrightsville Beach, NC 28480
(910) 256-3171
Wrightsville Beach, NC 28480
(910) 256-3171
Grades: K-5
| 273 students
Rank: #22.
Masonboro Elementary School
(Math: 93% | Reading: 84%)
Rank:
Rank:
10/
Top 5%10
3518 Masonboro Loop Road
Wilmington, NC 28409
(910) 790-2355
Wilmington, NC 28409
(910) 790-2355
Grades: K-5
| 583 students
Rank: #33.
Ogden Elementary School
(Math: 88% | Reading: 81%)
Rank:
Rank:
10/
Top 5%10
3637 Middle Sound Rd
Wilmington, NC 28411
(910) 686-6464
Wilmington, NC 28411
(910) 686-6464
Grades: K-5
| 607 students
Rank: #44.
Dr Hubert Eaton Sr Elementary School
(Math: 85% | Reading: 76%)
Rank:
Rank:
10/
Top 10%10
6701 Gordon Road
Wilmington, NC 28405
(910) 397-1544
Wilmington, NC 28405
(910) 397-1544
Grades: K-5
| 448 students
Rank: #55.
Dr John Codington Elementary School
(Math: 75% | Reading: 69%)
Rank:
Rank:
9/
Top 20%10
4321 Carolina Beach Road
Wilmington, NC 28412
(910) 790-2236
Wilmington, NC 28412
(910) 790-2236
Grades: K-5
| 448 students
Rank: #66.
Heyward C Bellamy Elementary School
(Math: 75% | Reading: 65%)
Rank:
Rank:
9/
Top 20%10
70 Sanders Rd
Wilmington, NC 28412
(910) 350-2039
Wilmington, NC 28412
(910) 350-2039
Grades: K-5
| 562 students
Rank: #77.
Holly Tree Elementary School
(Math: 71% | Reading: 69%)
Rank:
Rank:
9/
Top 20%10
3020 Web Trace
Wilmington, NC 28409
(910) 790-2250
Wilmington, NC 28409
(910) 790-2250
Grades: K-5
| 406 students
Rank: #88.
Charles P Murray Middle School
(Math: 73% | Reading: 61%)
Rank:
Rank:
9/
Top 20%10
655 Halyburton Memorial Parkwy
Wilmington, NC 28412
(910) 790-2363
Wilmington, NC 28412
(910) 790-2363
Grades: 6-8
| 899 students
Rank: #99.
Porters Neck Elementary School
(Math: 69% | Reading: 64%)
Rank:
Rank:
9/
Top 20%10
416 Edgewater Club Rd
Wilmington, NC 28411
(910) 251-2975
Wilmington, NC 28411
(910) 251-2975
Grades: K-5
| 655 students
Rank: #10 - 1110. - 11.
Carolina Beach Elementary School
(Math: 68% | Reading: 62%)
Rank:
Rank:
9/
Top 20%10
400 South 4th St
Carolina Beach, NC 28428
(910) 458-4340
Carolina Beach, NC 28428
(910) 458-4340
Grades: K-5
| 432 students
Rank: #10 - 1110. - 11.
Edwin A Anderson Elementary School
(Math: 68% | Reading: 62%)
Rank:
Rank:
9/
Top 20%10
455 Halyburton Memorial Parkwa
Wilmington, NC 28412
(910) 798-3311
Wilmington, NC 28412
(910) 798-3311
Grades: K-5
| 610 students
Rank: #1212.
M C S Noble Middle School
(Math: 66% | Reading: 65%)
Rank:
Rank:
9/
Top 20%10
6520 Market St
Wilmington, NC 28405
(910) 350-2112
Wilmington, NC 28405
(910) 350-2112
Grades: 6-8
| 647 students
Rank: #1313.
Bradley Creek Elementary School
(Math: 65-69% | Reading: 50-54%)
Rank:
Rank:
8/
Top 30%10
6211 Greenville Loop
Wilmington, NC 28409
(910) 350-2051
Wilmington, NC 28409
(910) 350-2051
Grades: K-5
| 381 students
Rank: #1414.
Roland-grise Middle School
(Math: 57% | Reading: 61%)
Rank:
Rank:
8/
Top 30%10
4412 Lake Ave
Wilmington, NC 28403
(910) 350-2136
Wilmington, NC 28403
(910) 350-2136
Grades: 6-8
| 848 students
Rank: #1515.
Pine Valley Elementary School
(Math: 60% | Reading: 55%)
Rank:
Rank:
7/
Top 50%10
440 John S Mosby Dr
Wilmington, NC 28412
(910) 350-2121
Wilmington, NC 28412
(910) 350-2121
Grades: K-5
| 455 students
Rank: #1616.
Castle Hayne Elementary School
(Math: 60-64% | Reading: 50-54%)
Rank:
Rank:
7/
Top 50%10
3925 Roger Haynes Drive
Castle Hayne, NC 28429
(910) 602-4970
Castle Hayne, NC 28429
(910) 602-4970
Grades: PK-5
| 496 students
Rank: #1717.
Murrayville Elementary School
(Math: 56% | Reading: 55%)
Rank:
Rank:
7/
Top 50%10
225 Mabee Way
Wilmington, NC 28411
(910) 790-5067
Wilmington, NC 28411
(910) 790-5067
Grades: PK-5
| 576 students
Rank: #1818.
Winter Park Model Elementary School
(Math: 55-59% | Reading: 50-54%)
Rank:
Rank:
7/
Top 50%10
204 S Macmillan Ave
Wilmington, NC 28403
(910) 350-2159
Wilmington, NC 28403
(910) 350-2159
Grades: K-5
| 291 students
Rank: #1919.
Mary C Williams Elementary School
(Math: 55-59% | Reading: 45-49%)
Rank:
Rank:
6/
Top 50%10
801 Silver Lake Rd
Wilmington, NC 28412
(910) 350-2150
Wilmington, NC 28412
(910) 350-2150
Grades: K-5
| 399 students
Rank: #2020.
Emma B Trask Middle School
(Math: 53% | Reading: 49%)
Rank:
Rank:
6/
Top 50%10
2900 N College Rd
Wilmington, NC 28405
(910) 350-2142
Wilmington, NC 28405
(910) 350-2142
Grades: 6-8
| 651 students
Rank: #2121.
Career Readiness Academy At Mosley Plc
Alternative School
(Math: 30-39% | Reading: 60-69%)
Rank:
Rank:
6/
Top 50%10
3702 Princess Place Drive
Wilmington, NC 28405
(910) 251-6161
Wilmington, NC 28405
(910) 251-6161
Grades: 6-12
| 86 students
Rank: #2222.
Myrtle Grove Middle School
(Math: 48% | Reading: 48%)
Rank:
Rank:
5/
Bottom 50%10
901 Piner Rd
Wilmington, NC 28409
(910) 350-2100
Wilmington, NC 28409
(910) 350-2100
Grades: 6-8
| 597 students
Rank: #2323.
Holly Shelter Middle School
(Math: 45% | Reading: 48%)
Rank:
Rank:
5/
Bottom 50%10
3921 Roger Haynes Dr
Castle Hayne, NC 28429
(910) 602-4046
Castle Hayne, NC 28429
(910) 602-4046
Grades: 6-8
| 822 students
Rank: #2424.
Edwin A Alderman Elementary School
(Math: 45-49% | Reading: 40-44%)
Rank:
Rank:
5/
Bottom 50%10
2025 Independence Blvd
Wilmington, NC 28403
(910) 350-2031
Wilmington, NC 28403
(910) 350-2031
Grades: K-5
| 274 students
Rank: #2525.
The International School At Gregory
Magnet School
(Math: 41% | Reading: 46%)
Rank:
Rank:
4/
Bottom 50%10
1106 Ann St
Wilmington, NC 28401
(910) 251-6185
Wilmington, NC 28401
(910) 251-6185
Grades: K-8
| 508 students
Rank: #2626.
John J Blair Elementary School
(Math: 45% | Reading: 39%)
Rank:
Rank:
4/
Bottom 50%10
6510 Market Street
Wilmington, NC 28405
(910) 350-2045
Wilmington, NC 28405
(910) 350-2045
Grades: PK-5
| 455 students
Rank: #2727.
Sunset Park Elementary School
(Math: 40-44% | Reading: 25-29%)
Rank:
Rank:
3/
Bottom 50%10
613 Alabama Ave
Wilmington, NC 28401
(910) 815-6948
Wilmington, NC 28401
(910) 815-6948
Grades: K-5
| 407 students
Rank: #2828.
College Park Elementary School
(Math: 35% | Reading: 29%)
Rank:
Rank:
2/
Bottom 50%10
5001 Oriole Drive
Wilmington, NC 28403
(910) 350-2058
Wilmington, NC 28403
(910) 350-2058
Grades: K-5
| 444 students
Rank: #2929.
Williston Middle School
(Math: 25% | Reading: 30%)
Rank:
Rank:
2/
Bottom 50%10
401 S 10th St
Wilmington, NC 28401
(910) 815-6906
Wilmington, NC 28401
(910) 815-6906
Grades: 6-8
| 661 students
Rank: #3030.
Wrightsboro Elementary School
(Math: 27% | Reading: 27%)
Rank:
Rank:
2/
Bottom 50%10
2716 Castle Hayne Rd
Wilmington, NC 28401
(910) 815-6909
Wilmington, NC 28401
(910) 815-6909
Grades: PK-5
| 470 students
Rank: #3131.
A H Snipes Academy Of Arts/des
Magnet School
(Math: 25-29% | Reading: 20-24%)
Rank:
Rank:
1/
Bottom 50%10
2150 Chestnut Street
Wilmington, NC 28405
(910) 251-6175
Wilmington, NC 28405
(910) 251-6175
Grades: K-5
| 354 students
Rank: #32 - 3332. - 33.
J. C. Roe Center
Alternative School
(Math: ≤20% | Reading: ≤20%)
Rank:
Rank:
1/
Bottom 50%10
2875 Worth Drive
Wilmington, NC 28412
(910) 395-4472
Wilmington, NC 28412
(910) 395-4472
Grades: 6-12
| 12 students
Rank: #32 - 3332. - 33.
Lake Forest Academy
Alternative School
(Math: ≤20% | Reading: ≤20%)
Rank:
Rank:
1/
Bottom 50%10
1802 S 15th Street
Wilmington, NC 28401
(910) 772-2515
Wilmington, NC 28401
(910) 772-2515
Grades: K-8
| 43 students
Rank: #3434.
Forest Hills Global Elementary School
(Math: 19% | Reading: 19%)
Rank:
Rank:
1/
Bottom 50%10
602 Colonial Drive
Wilmington, NC 28403
(910) 251-6190
Wilmington, NC 28403
(910) 251-6190
Grades: K-5
| 355 students
Rank: #3535.
R Freeman Sch Of Engineering
Magnet School
(Math: 6-9% | Reading: 6-9%)
Rank:
Rank:
1/
Bottom 50%10
2601 Princess Place Drive
Wilmington, NC 28405
(910) 251-6011
Wilmington, NC 28405
(910) 251-6011
Grades: PK-5
| 263 students
Recent Articles

What Is A Charter School?
Explore the world of charter schools in this comprehensive guide. Learn about their history, how they operate, and the pros and cons of this educational innovation. Discover key facts about charter schools, including admission policies, demographics, and funding, as well as what to look for when considering a charter school for your child.

10 Reasons Why High School Sports Benefit Students
Discover the 10 compelling reasons why high school sports are beneficial for students. This comprehensive article explores how athletics enhance academic performance, foster personal growth, and develop crucial life skills. From improved fitness and time management to leadership development and community representation, learn why participating in high school sports can be a game-changer for students' overall success and well-being.

February 05, 2025
Understanding the U.S. Department of Education: Structure, Impact, and EvolutionWe explore how the Department of Education shapes American education, from its cabinet-level leadership to its impact on millions of students, written for general audiences seeking clarity on this vital institution.


