Top Rankings
Portland SD 1j School District ranks among the top 20% of public school district in Oregon for:
Category
Attribute
Overall Rank
Highest overall rank (Top 10%)
Math Proficiency
Highest math proficiency (Top 20%)
Reading/Language Arts Proficiency
Highest reading/language arts proficiency (Top 20%)
Science Proficiency
Highest science proficiency (Top 20%)
Diversity
Most diverse schools (Top 1%)
Community Size
Largest student body (number of students) (Top 1%)
For the 2025 school year, there are 86 public schools serving 42,518 students in Portland SD 1j School District. This district's average testing ranking is 10/10, which is in the top 10% of public schools in Oregon.
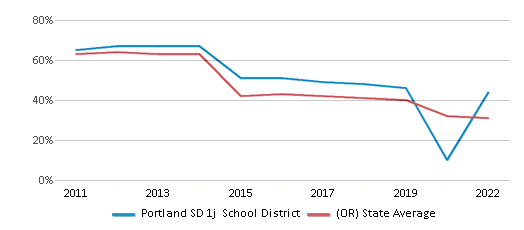
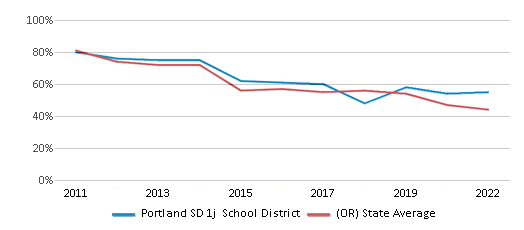
Public Schools in Portland SD 1j School District have an average math proficiency score of 44% (versus the Oregon public school average of 31%), and reading proficiency score of 55% (versus the 44% statewide average).
Minority enrollment is 46% of the student body (majority Hispanic), which is more than the Oregon public school average of 42% (majority Hispanic).
Overview
This School District
This State (OR)
# Schools
86 Schools
1,302 Schools
# Students
42,518 Students
541,703 Students
# Teachers
2,527 Teachers
29,489 Teachers
Student : Teacher Ratio
17:1
17:1
District Rank
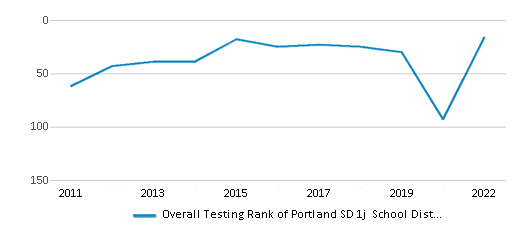
Portland SD 1j School District, which is ranked within the top 10% of all 186 school districts in Oregon (based off of combined math and reading proficiency testing data) for the 2021-2022 school year.
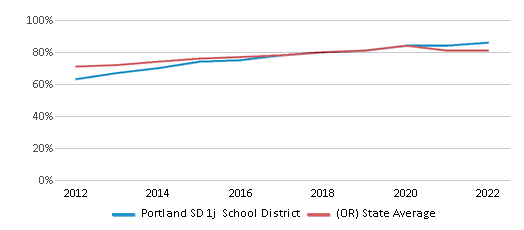
The school district's graduation rate of 86% has increased from 78% over five school years.
Overall District Rank
#16 out of 189 school districts
(Top 10%)
(Top 10%)
Math Test Scores (% Proficient)
44%
31%
Reading/Language Arts Test Scores (% Proficient)
55%
44%
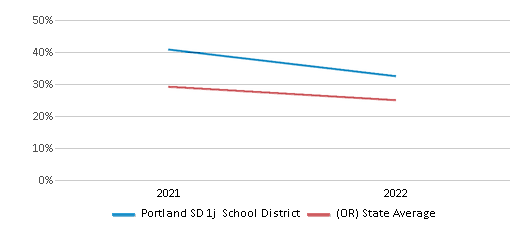
Science Test Scores (% Proficient)
39%
30%
Graduation Rate
86%
81%
Students by Ethnicity:
Diversity Score
0.66
0.60
# American Indian Students
181 Students
6,222 Students
% American Indian Students
1%
1%
# Asian Students
2,433 Students
22,114 Students
% Asian Students
6%
4%
# Hispanic Students
7,344 Students
140,608 Students
% Hispanic Students
18%
26%
# Black Students
3,403 Students
12,826 Students
% Black Students
8%
3%
# White Students
23,048 Students
312,965 Students
% White Students
54%
58%
# Hawaiian Students
325 Students
4,696 Students
% Hawaiian Students
1%
1%
# Two or more races Students
5,156 Students
39,453 Students
% of Two or more races Students
12%
7%
Students by Grade:
# Students in PK Grade:
-
-
# Students in K Grade:
2,988
35,446
# Students in 1st Grade:
3,205
38,201
# Students in 2nd Grade:
3,317
40,364
# Students in 3rd Grade:
3,262
39,761
# Students in 4th Grade:
3,393
41,356
# Students in 5th Grade:
3,395
41,259
# Students in 6th Grade:
3,126
41,436
# Students in 7th Grade:
3,241
41,680
# Students in 8th Grade:
3,192
42,445
# Students in 9th Grade:
3,371
44,713
# Students in 10th Grade:
3,466
46,380
# Students in 11th Grade:
3,353
44,723
# Students in 12th Grade:
3,209
43,939
# Ungraded Students:
-
-
District Revenue and Spending
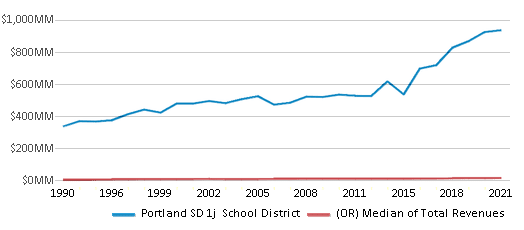
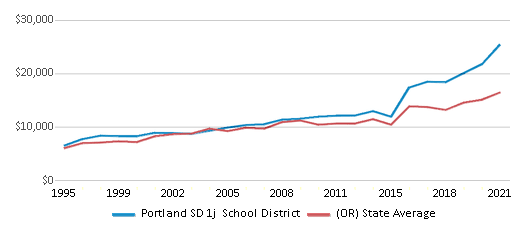
The revenue/student of $22,031 is higher than the state median of $18,279. The school district revenue/student has grown by 6% over four school years.
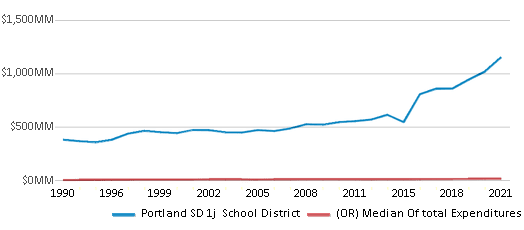
The school district's spending/student of $27,099 is higher than the state median of $19,325. The school district spending/student has grown by 6% over four school years.
Total Revenue
$937 MM
$9,902 MM
Spending
$1,152 MM
$10,468 MM
Revenue / Student
$22,031
$18,279
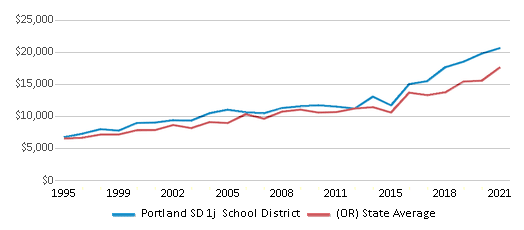
Spending / Student
$27,099
$19,325
Best Portland SD 1j School District Public Schools (2025)
School
(Math and Reading Proficiency)
(Math and Reading Proficiency)
Location
Grades
Students
Rank: #11.
Winterhaven School
(Math: 83% | Reading: 85%)
Rank:
Rank:
10/
Top 1%10
3830 Se 14th Ave
Portland, OR 97202
(503) 916-6200
Portland, OR 97202
(503) 916-6200
Grades: K-8
| 315 students
Rank: #22.
Alameda Elementary School
(Math: 82% | Reading: 85%)
Rank:
Rank:
10/
Top 1%10
2732 Ne Fremont St
Portland, OR 97212
(503) 916-6036
Portland, OR 97212
(503) 916-6036
Grades: K-5
| 521 students
Rank: #3 - 43. - 4.
Forest Park Elementary School
(Math: 75-79% | Reading: 80-84%)
Rank:
Rank:
10/
Top 1%10
9935 Nw Durrett St
Portland, OR 97229
(503) 916-5400
Portland, OR 97229
(503) 916-5400
Grades: K-5
| 321 students
Rank: #3 - 43. - 4.
Rieke Elementary School
(Math: 75-79% | Reading: 80-84%)
Rank:
Rank:
10/
Top 1%10
1405 Sw Vermont
Portland, OR 97219
(503) 916-5768
Portland, OR 97219
(503) 916-5768
Grades: K-5
| 288 students
Rank: #55.
Le Monde French Immersion Public Charter School
Charter School
(Math: 75% | Reading: 83%)
Rank:
Rank:
10/
Top 1%10
2044 E Burnside St
Portland, OR 97214
(503) 467-7529
Portland, OR 97214
(503) 467-7529
Grades: K-8
| 378 students
Rank: #66.
Llewellyn Elementary School
(Math: 70-74% | Reading: 80-84%)
Rank:
Rank:
10/
Top 5%10
6301 Se 14th Ave
Portland, OR 97202
(503) 916-6216
Portland, OR 97202
(503) 916-6216
Grades: K-5
| 393 students
Rank: #77.
Stephenson Elementary School
(Math: 70-74% | Reading: 75-79%)
Rank:
Rank:
10/
Top 5%10
2627 Sw Stephenson St
Portland, OR 97219
(503) 916-6318
Portland, OR 97219
(503) 916-6318
Grades: K-5
| 310 students
Rank: #88.
Abernethy Elementary School
(Math: 73% | Reading: 76%)
Rank:
Rank:
10/
Top 5%10
2421 Se Orange Ave
Portland, OR 97214
(503) 916-6190
Portland, OR 97214
(503) 916-6190
Grades: K-5
| 330 students
Rank: #99.
Duniway Elementary School
(Math: 72% | Reading: 76%)
Rank:
Rank:
10/
Top 5%10
7700 Se Reed College Pl
Portland, OR 97202
(503) 916-6343
Portland, OR 97202
(503) 916-6343
Grades: K-5
| 409 students
Rank: #1010.
Bridlemile Elementary School
(Math: 69% | Reading: 78%)
Rank:
Rank:
10/
Top 5%10
4300 Sw 47th Dr
Portland, OR 97221
(503) 916-6292
Portland, OR 97221
(503) 916-6292
Grades: K-5
| 446 students
Rank: #1111.
Ainsworth Elementary School
(Math: 71% | Reading: 76%)
Rank:
Rank:
10/
Top 5%10
2425 Sw Vista Ave
Portland, OR 97201
(503) 916-6288
Portland, OR 97201
(503) 916-6288
Grades: K-5
| 585 students
Rank: #1212.
Beverly Cleary School
(Math: 67% | Reading: 75%)
Rank:
Rank:
10/
Top 5%10
1915 Ne 33rd
Portland, OR 97212
(503) 916-6480
Portland, OR 97212
(503) 916-6480
Grades: K-8
| 558 students
Rank: #1313.
Laurelhurst Elementary School
(Math: 63% | Reading: 80%)
Rank:
Rank:
10/
Top 5%10
840 Ne 41st Ave
Portland, OR 97232
(503) 916-6210
Portland, OR 97232
(503) 916-6210
Grades: K-8
| 658 students
Rank: #1414.
Sabin Elementary School
(Math: 65-69% | Reading: 70-74%)
Rank:
Rank:
10/
Top 5%10
4013 Ne 18th Ave
Portland, OR 97212
(503) 916-6181
Portland, OR 97212
(503) 916-6181
Grades: PK-5
| 302 students
Rank: #15 - 1615. - 16.
Glencoe Elementary School
(Math: 60-64% | Reading: 70-74%)
Rank:
Rank:
10/
Top 5%10
825 Se 51st Ave
Portland, OR 97215
(503) 916-6207
Portland, OR 97215
(503) 916-6207
Grades: K-5
| 372 students
Rank: #15 - 1615. - 16.
Maplewood Elementary School
(Math: 60-64% | Reading: 70-74%)
Rank:
Rank:
10/
Top 5%10
7452 Sw 52nd Ave
Portland, OR 97219
(503) 916-6308
Portland, OR 97219
(503) 916-6308
Grades: K-5
| 301 students
Rank: #1717.
Hayhurst Elementary School
(Math: 63% | Reading: 71%)
Rank:
Rank:
10/
Top 10%10
5037 Sw Iowa St
Portland, OR 97221
(503) 916-6300
Portland, OR 97221
(503) 916-6300
Grades: K-8
| 562 students
Rank: #1818.
Cleveland High School
(Math: 55-59% | Reading: 70-74%)
Rank:
Rank:
10/
Top 10%10
3400 Se 26th Ave
Portland, OR 97202
(503) 916-5120
Portland, OR 97202
(503) 916-5120
Grades: 9-12
| 1,472 students
Rank: #19 - 2019. - 20.
Richmond Elementary School
(Math: 55% | Reading: 74%)
Rank:
Rank:
10/
Top 10%10
2276 Se 41st Ave
Portland, OR 97214
(503) 916-6220
Portland, OR 97214
(503) 916-6220
Grades: PK-5
| 537 students
Rank: #19 - 2019. - 20.
West Sylvan Middle School
(Math: 59% | Reading: 71%)
Rank:
Rank:
10/
Top 10%10
8111 Sw West Slope Dr
Portland, OR 97225
(503) 916-5690
Portland, OR 97225
(503) 916-5690
Grades: 6-8
| 723 students
Rank: #21 - 2221. - 22.
Capitol Hill Elementary School
(Math: 60-64% | Reading: 65-69%)
Rank:
Rank:
10/
Top 10%10
8401 Sw 17th Ave
Portland, OR 97219
(503) 916-6303
Portland, OR 97219
(503) 916-6303
Grades: K-5
| 361 students
Rank: #21 - 2221. - 22.
Skyline Elementary School
(Math: 60-64% | Reading: 65-69%)
Rank:
Rank:
10/
Top 10%10
11536 Nw Skyline Blvd
Portland, OR 97231
(503) 916-5212
Portland, OR 97231
(503) 916-5212
Grades: K-8
| 218 students
Rank: #2323.
Lewis Elementary School
(Math: 55-59% | Reading: 65-69%)
Rank:
Rank:
10/
Top 10%10
4401 Se Evergreen St
Portland, OR 97206
(503) 916-6360
Portland, OR 97206
(503) 916-6360
Grades: K-5
| 297 students
Rank: #2424.
Beach Elementary School
(Math: 60-64% | Reading: 60-64%)
Rank:
Rank:
10/
Top 10%10
1710 N Humboldt St
Portland, OR 97217
(503) 916-6236
Portland, OR 97217
(503) 916-6236
Grades: PK-5
| 325 students
Rank: #2525.
Atkinson Elementary School
(Math: 50-54% | Reading: 65-69%)
Rank:
Rank:
10/
Top 10%10
5800 Se Division St
Portland, OR 97206
(503) 916-6333
Portland, OR 97206
(503) 916-6333
Grades: K-5
| 366 students
Rank: #2626.
Emerson School
Charter School
(Math: 50-54% | Reading: 60-64%)
Rank:
Rank:
10/
Top 10%10
105 Nw Park Ave
Portland, OR 97209
(503) 525-6124
Portland, OR 97209
(503) 525-6124
Grades: K-5
| 134 students
Rank: #2727.
Grant High School
(Math: 40-49% | Reading: 80-89%)
Rank:
Rank:
9/
Top 20%10
2245 Ne 36th Ave
Portland, OR 97212
(503) 916-5160
Portland, OR 97212
(503) 916-5160
Grades: 9-12
| 2,179 students
Rank: #2828.
Woodstock Elementary School
(Math: 61% | Reading: 61%)
Rank:
Rank:
9/
Top 20%10
5601 Se 50th Ave
Portland, OR 97206
(503) 916-6380
Portland, OR 97206
(503) 916-6380
Grades: K-5
| 451 students
Rank: #2929.
Gray Middle School
(Math: 47% | Reading: 70%)
Rank:
Rank:
9/
Top 20%10
5505 Sw 23rd Ave
Portland, OR 97239
(503) 916-5676
Portland, OR 97239
(503) 916-5676
Grades: 6-8
| 471 students
Rank: #3030.
Sellwood Middle School
(Math: 49% | Reading: 68%)
Rank:
Rank:
9/
Top 20%10
8300 Se 15th Ave
Portland, OR 97202
(503) 916-5656
Portland, OR 97202
(503) 916-5656
Grades: 6-8
| 567 students
Rank: #3131.
Metropolitan Learning Center
Alternative School
(Math: 47% | Reading: 65-69%)
Rank:
Rank:
9/
Top 20%10
2033 Nw Glisan St
Portland, OR 97209
(503) 916-5737
Portland, OR 97209
(503) 916-5737
Grades: K-12
| 337 students
Rank: #3232.
Creston Elementary School
(Math: 50-54% | Reading: 55-59%)
Rank:
Rank:
9/
Top 20%10
4701 Se Bush St
Portland, OR 97206
(503) 916-6340
Portland, OR 97206
(503) 916-6340
Grades: K-5
| 238 students
Rank: #3333.
Sunnyside Environmental School
(Math: 50% | Reading: 58%)
Rank:
Rank:
9/
Top 20%10
3421 Se Salmon St
Portland, OR 97214
(503) 916-6226
Portland, OR 97214
(503) 916-6226
Grades: K-8
| 447 students
Rank: #3434.
Hosford Middle School
(Math: 45% | Reading: 64%)
Rank:
Rank:
9/
Top 20%10
2303 Se 28th Pl
Portland, OR 97214
(503) 916-5640
Portland, OR 97214
(503) 916-5640
Grades: 6-8
| 517 students
Rank: #3535.
Mt Tabor Middle School
(Math: 44% | Reading: 62%)
Rank:
Rank:
9/
Top 20%10
5800 Se Ash St
Portland, OR 97215
(503) 916-5646
Portland, OR 97215
(503) 916-5646
Grades: 6-8
| 504 students
Show 51 more public schools in Portland SD 1j School District (out of 86 total schools)
Loading...
Frequently Asked Questions
How many schools belong to Portland SD 1j School District?
Portland SD 1j School District manages 86 public schools serving 42,518 students.
What is the rank of Portland SD 1j School District?
Portland SD 1j School District is ranked #16 out of 186 school districts in Oregon (top 10%) based off of combined math and reading proficiency testing data for the 2021-2022 school year. This district ranks in the top 20% of Oregon school districts for: Highest overall rank (Top 10%), Highest math proficiency (Top 20%), Highest reading/language arts proficiency (Top 20%), Highest science proficiency (Top 20%), Most diverse schools (Top 1%) and Largest student body (number of students) (Top 1%)
What is the racial composition of students in Portland SD 1j School District?
54% of Portland SD 1j School District students are White, 18% of students are Hispanic, 12% of students are Two or more races, 8% of students are Black, 6% of students are Asian, 1% of students are American Indian, and 1% of students are Hawaiian.
What is the student/teacher ratio of Portland SD 1j School District?
Portland SD 1j School District has a student/teacher ratio of 17:1, which is lower than the Oregon state average of 18:1.
What is Portland SD 1j School District's spending/student ratio?
The school district's spending/student of $27,099 is higher than the state median of $19,325. The school district spending/student has grown by 6% over four school years.
Recent Articles

What Is A Charter School?
Explore the world of charter schools in this comprehensive guide. Learn about their history, how they operate, and the pros and cons of this educational innovation. Discover key facts about charter schools, including admission policies, demographics, and funding, as well as what to look for when considering a charter school for your child.

10 Reasons Why High School Sports Benefit Students
Discover the 10 compelling reasons why high school sports are beneficial for students. This comprehensive article explores how athletics enhance academic performance, foster personal growth, and develop crucial life skills. From improved fitness and time management to leadership development and community representation, learn why participating in high school sports can be a game-changer for students' overall success and well-being.

February 05, 2025
Understanding the U.S. Department of Education: Structure, Impact, and EvolutionWe explore how the Department of Education shapes American education, from its cabinet-level leadership to its impact on millions of students, written for general audiences seeking clarity on this vital institution.


