Top Rankings
Chambersburg Area School District ranks among the top 20% of public school district in Pennsylvania for:
Category
Attribute
Diversity
Most diverse schools (Top 1%)
Community Size
Largest student body (number of students) (Top 1%)
For the 2025 school year, there are 17 public schools serving 9,250 students in Chambersburg Area School District. This district's average testing ranking is 5/10, which is in the bottom 50% of public schools in Pennsylvania.
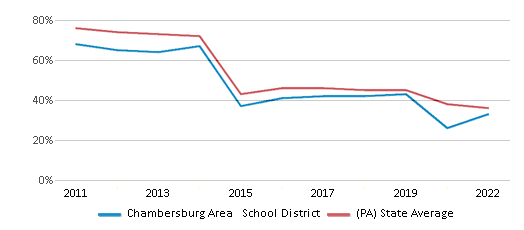
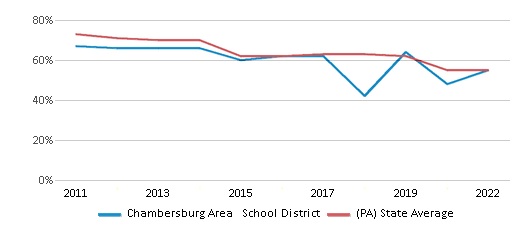
Public Schools in Chambersburg Area School District have an average math proficiency score of 33% (versus the Pennsylvania public school average of 36%), and reading proficiency score of 55% (versus the 55% statewide average).
Minority enrollment is 43% of the student body (majority Hispanic), which is more than the Pennsylvania public school average of 39% (majority Hispanic and Black).
Overview
This School District
This State (PA)
# Schools
17 Schools
2,928 Schools
# Students
9,250 Students
1,668,648 Students
# Teachers
579 Teachers
124,158 Teachers
Student : Teacher Ratio
16:1
16:1
District Rank
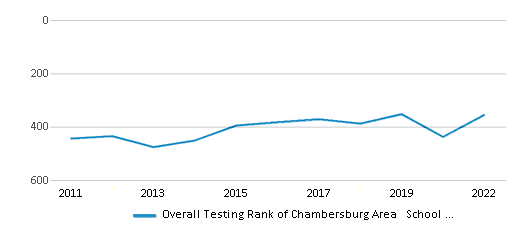
Chambersburg Area School District, which is ranked within the bottom 50% of all 675 school districts in Pennsylvania (based off of combined math and reading proficiency testing data) for the 2021-2022 school year.
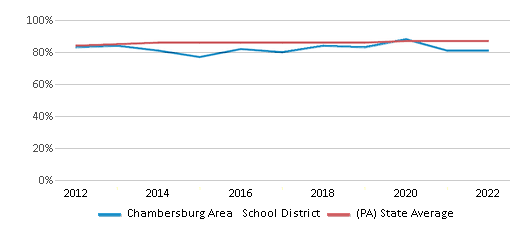
The school district's graduation rate of 81% has increased from 80% over five school years.
Overall District Rank
#355 out of 684 school districts
(Bottom 50%)
(Bottom 50%)
Math Test Scores (% Proficient)
33%
36%
Reading/Language Arts Test Scores (% Proficient)
55%
55%
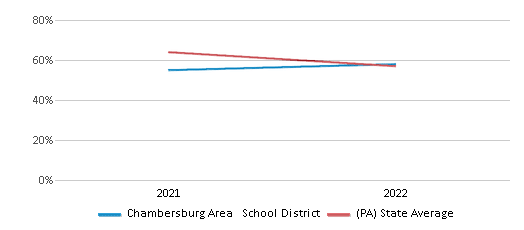
Science Test Scores (% Proficient)
58%
57%
Graduation Rate
81%
87%
Students by Ethnicity:
Diversity Score
0.60
0.59
# American Indian Students
6 Students
3,204 Students
% American Indian Students
n/a
n/a
# Asian Students
173 Students
78,034 Students
% Asian Students
2%
5%
# Hispanic Students
2,394 Students
249,018 Students
% Hispanic Students
26%
15%
# Black Students
667 Students
237,342 Students
% Black Students
7%
14%
# White Students
5,287 Students
1,011,502 Students
% White Students
57%
61%
# Hawaiian Students
9 Students
1,518 Students
% Hawaiian Students
n/a
n/a
# Two or more races Students
714 Students
88,750 Students
% of Two or more races Students
8%
5%
Students by Grade:
# Students in PK Grade:
-
8,485
# Students in K Grade:
689
114,122
# Students in 1st Grade:
679
120,768
# Students in 2nd Grade:
734
126,133
# Students in 3rd Grade:
653
120,907
# Students in 4th Grade:
701
125,578
# Students in 5th Grade:
662
126,001
# Students in 6th Grade:
722
126,714
# Students in 7th Grade:
692
128,950
# Students in 8th Grade:
710
129,786
# Students in 9th Grade:
691
141,323
# Students in 10th Grade:
754
138,358
# Students in 11th Grade:
766
131,939
# Students in 12th Grade:
797
129,584
# Ungraded Students:
-
-
District Revenue and Spending
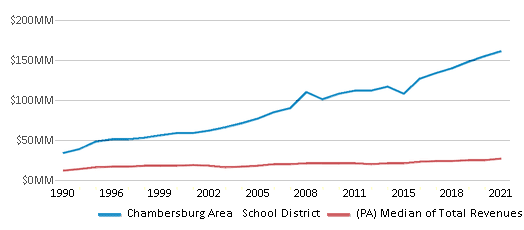
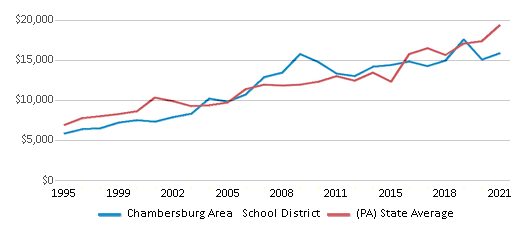
The revenue/student of $17,423 in this school district is less than the state median of $23,696. The school district revenue/student has stayed relatively flat over four school years.
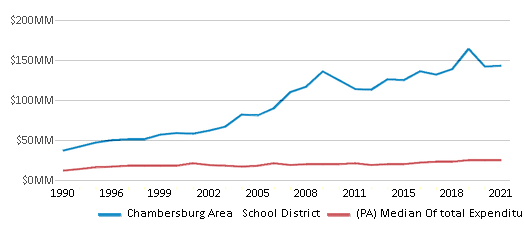
The school district's spending/student of $15,476 is less than the state median of $23,119. The school district spending/student has stayed relatively flat over four school years.
Total Revenue
$161 MM
$39,541 MM
Spending
$143 MM
$38,578 MM
Revenue / Student
$17,423
$23,696
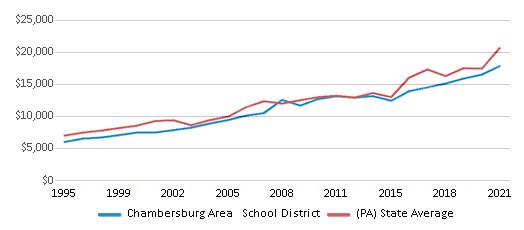
Spending / Student
$15,476
$23,119
Best Chambersburg Area School District Public Schools (2025)
School
(Math and Reading Proficiency)
(Math and Reading Proficiency)
Location
Grades
Students
Rank: #11.
Guilford Hills Elementary School
(Math: 55-59% | Reading: 70-74%)
Rank:
Rank:
9/
Top 20%10
2105 Lincoln Way E
Chambersburg, PA 17202
(717) 352-2124
Chambersburg, PA 17202
(717) 352-2124
Grades: K-5
| 176 students
Rank: #22.
Chambersburg Area Sr. High School
(Math: 80-84% | Reading: 55%)
Rank:
Rank:
8/
Top 30%10
511 S 6th St
Chambersburg, PA 17201
(717) 261-3328
Chambersburg, PA 17201
(717) 261-3328
Grades: 9-12
| 2,324 students
Rank: #33.
Chambersburg Area Career Magnet School
Magnet School
(Math: ≥90% | Reading: 50-54%)
Rank:
Rank:
8/
Top 30%10
2459 Loop Road
Chambersburg, PA 17202
(717) 261-5656
Chambersburg, PA 17202
(717) 261-5656
Grades: 9-12
| 684 students
Rank: #44.
South Hamilton Elementary School
(Math: 45-49% | Reading: 60-64%)
Rank:
Rank:
7/
Top 50%10
1019 Warm Spring Rd
Chambersburg, PA 17202
(717) 261-3449
Chambersburg, PA 17202
(717) 261-3449
Grades: K-5
| 267 students
Rank: #55.
Hamilton Heights Elementary School
(Math: 43% | Reading: 59%)
Rank:
Rank:
6/
Top 50%10
1589 Johnson Rd
Chambersburg, PA 17201
(717) 261-3448
Chambersburg, PA 17201
(717) 261-3448
Grades: K-5
| 544 students
Rank: #66.
Chambersburg Area Middle School - North
(Math: 27% | Reading: 65%)
Rank:
Rank:
5/
Bottom 50%10
1957 Scotland Ave
Chambersburg, PA 17201
(717) 261-3369
Chambersburg, PA 17201
(717) 261-3369
Grades: 6-8
| 1,050 students
Rank: #7 - 87. - 8.
Falling Spring Elementary School
(Math: 40-44% | Reading: 50-54%)
Rank:
Rank:
5/
Bottom 50%10
1006 Falling Spring Rd
Chambersburg, PA 17202
(717) 261-3440
Chambersburg, PA 17202
(717) 261-3440
Grades: K-5
| 242 students
Rank: #7 - 87. - 8.
Marion Elementary School
(Math: 40-44% | Reading: 50-54%)
Rank:
Rank:
5/
Bottom 50%10
145 Colorado St
Chambersburg, PA 17202
(717) 375-2360
Chambersburg, PA 17202
(717) 375-2360
Grades: K-5
| 266 students
Rank: #99.
Chambersburg Area Middle School - South
(Math: 30% | Reading: 58%)
Rank:
Rank:
5/
Bottom 50%10
1151 E Mckinley St
Chambersburg, PA 17201
(717) 261-3385
Chambersburg, PA 17201
(717) 261-3385
Grades: 6-8
| 1,074 students
Rank: #1010.
Scotland Elementary School
(Math: 35-39% | Reading: 50-54%)
Rank:
Rank:
5/
Bottom 50%10
3832 Scotland Main St
Chambersburg, PA 17202
(717) 261-3460
Chambersburg, PA 17202
(717) 261-3460
Grades: K-5
| 438 students
Rank: #1111.
New Franklin Elementary School
(Math: 40-44% | Reading: 45-49%)
Rank:
Rank:
4/
Bottom 50%10
3584 Wayne Rd
Chambersburg, PA 17202
(717) 261-3454
Chambersburg, PA 17202
(717) 261-3454
Grades: K-5
| 200 students
Rank: #1212.
Fayetteville Elementary School
(Math: 38% | Reading: 48%)
Rank:
Rank:
4/
Bottom 50%10
8 E Main St
Fayetteville, PA 17222
(717) 352-2774
Fayetteville, PA 17222
(717) 352-2774
Grades: K-5
| 465 students
Rank: #1313.
Grandview Elementary School
(Math: 30-34% | Reading: 40-44%)
Rank:
Rank:
3/
Bottom 50%10
5538 Cumberland Hwy
Chambersburg, PA 17202
(717) 261-3445
Chambersburg, PA 17202
(717) 261-3445
Grades: K-5
| 293 students
Rank: #1414.
Buchanan Elementary School
(Math: 20-24% | Reading: 30-34%)
Rank:
Rank:
2/
Bottom 50%10
730 E Washington St
Chambersburg, PA 17201
(717) 261-3432
Chambersburg, PA 17201
(717) 261-3432
Grades: K-5
| 239 students
Rank: #1515.
Benjamin Chambers Elementary School
(Math: 21% | Reading: 35%)
Rank:
Rank:
2/
Bottom 50%10
481 North Franklin St
Chambersburg, PA 17201
(717) 261-3442
Chambersburg, PA 17201
(717) 261-3442
Grades: K-5
| 564 students
Rank: #1616.
Stevens Elementary School
(Math: 15-19% | Reading: 30-34%)
Rank:
Rank:
2/
Bottom 50%10
800 Hollywell Ave
Chambersburg, PA 17201
(717) 261-3470
Chambersburg, PA 17201
(717) 261-3470
Grades: K-5
| 305 students
Rank: #1717.
Lurgan Elementary School
(Math: 10-14% | Reading: 35-39%)
Rank:
Rank:
2/
Bottom 50%10
8888 Roxbury Rd
Lurgan, PA 17232
(717) 532-6125
Lurgan, PA 17232
(717) 532-6125
Grades: K-5
| 119 students
Frequently Asked Questions
How many schools belong to Chambersburg Area School District?
Chambersburg Area School District manages 17 public schools serving 9,250 students.
What is the rank of Chambersburg Area School District?
Chambersburg Area School District is ranked #356 out of 675 school districts in Pennsylvania (bottom 50%) based off of combined math and reading proficiency testing data for the 2021-2022 school year. This district ranks in the top 20% of Pennsylvania school districts for: Most diverse schools (Top 1%) and Largest student body (number of students) (Top 1%)
What is the racial composition of students in Chambersburg Area School District?
57% of Chambersburg Area School District students are White, 26% of students are Hispanic, 8% of students are Two or more races, 7% of students are Black, and 2% of students are Asian.
What is the student/teacher ratio of Chambersburg Area School District?
Chambersburg Area School District has a student/teacher ratio of 16:1, which is higher than the Pennsylvania state average of 14:1.
What is Chambersburg Area School District's spending/student ratio?
The school district's spending/student of $15,476 is less than the state median of $23,119. The school district spending/student has stayed relatively flat over four school years.
Recent Articles

What Is A Charter School?
Explore the world of charter schools in this comprehensive guide. Learn about their history, how they operate, and the pros and cons of this educational innovation. Discover key facts about charter schools, including admission policies, demographics, and funding, as well as what to look for when considering a charter school for your child.

10 Reasons Why High School Sports Benefit Students
Discover the 10 compelling reasons why high school sports are beneficial for students. This comprehensive article explores how athletics enhance academic performance, foster personal growth, and develop crucial life skills. From improved fitness and time management to leadership development and community representation, learn why participating in high school sports can be a game-changer for students' overall success and well-being.

February 05, 2025
Understanding the U.S. Department of Education: Structure, Impact, and EvolutionWe explore how the Department of Education shapes American education, from its cabinet-level leadership to its impact on millions of students, written for general audiences seeking clarity on this vital institution.


