Top Rankings
Pittsburgh School District ranks among the top 20% of public school district in Pennsylvania for:
Category
Attribute
Diversity
Most diverse schools (Top 1%)
Community Size
Largest student body (number of students) (Top 1%)
For the 2025 school year, there are 50 public elementary schools serving 15,966 students in Pittsburgh School District. This district's average elementary testing ranking is 3/10, which is in the bottom 50% of public elementary schools in Pennsylvania.
Public Elementary Schools in Pittsburgh School District have an average math proficiency score of 22% (versus the Pennsylvania public elementary school average of 35%), and reading proficiency score of 42% (versus the 54% statewide average).
Minority enrollment is 71% of the student body (majority Black), which is more than the Pennsylvania public elementary school average of 42% (majority Hispanic and Black).
Overview
This School District
This State (PA)
# Schools
56 Schools
2,145 Schools
# Students
19,367 Students
1,108,977 Students
# Teachers
1,662 Teachers
82,943 Teachers
Student : Teacher Ratio
12:1
12:1
District Rank
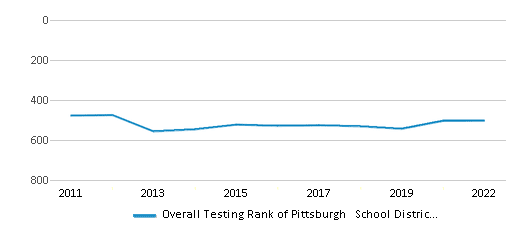
Pittsburgh School District, which is ranked within the bottom 50% of all 675 school districts in Pennsylvania (based off of combined math and reading proficiency testing data) for the 2021-2022 school year.
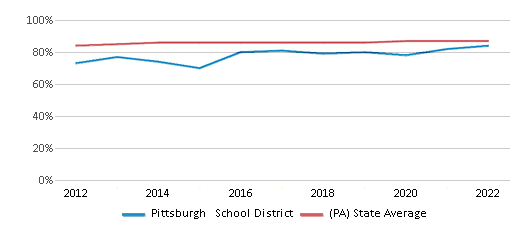
The school district's graduation rate of 84% has increased from 81% over five school years.
Overall District Rank
#502 out of 684 school districts
(Bottom 50%)
(Bottom 50%)
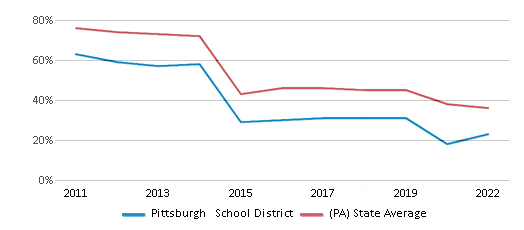
Math Test Scores (% Proficient)
23%
36%
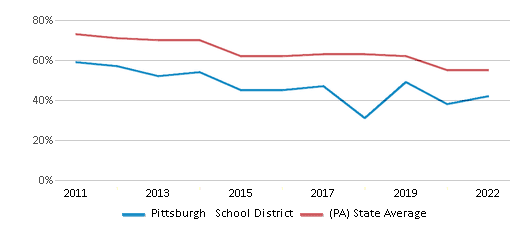
Reading/Language Arts Test Scores (% Proficient)
42%
55%
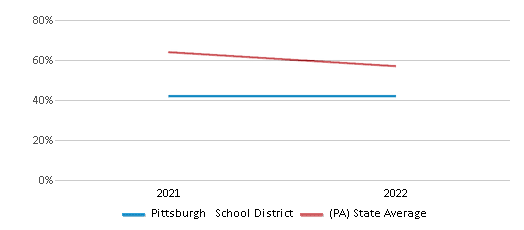
Science Test Scores (% Proficient)
42%
57%
Graduation Rate
84%
87%
Students by Ethnicity:
Diversity Score
0.65
0.61
# American Indian Students
25 Students
2,278 Students
% American Indian Students
n/a
n/a
# Asian Students
828 Students
51,838 Students
% Asian Students
4%
5%
# Hispanic Students
1,222 Students
173,776 Students
% Hispanic Students
6%
16%
# Black Students
9,712 Students
169,696 Students
% Black Students
50%
15%
# White Students
5,721 Students
645,871 Students
% White Students
30%
58%
# Hawaiian Students
26 Students
965 Students
% Hawaiian Students
n/a
n/a
# Two or more races Students
1,833 Students
63,991 Students
% of Two or more races Students
10%
6%
Students by Grade:
# Students in PK Grade:
1,232
7,744
# Students in K Grade:
1,537
110,287
# Students in 1st Grade:
1,574
120,767
# Students in 2nd Grade:
1,447
126,133
# Students in 3rd Grade:
1,299
120,907
# Students in 4th Grade:
1,350
125,574
# Students in 5th Grade:
1,379
126,000
# Students in 6th Grade:
1,344
126,698
# Students in 7th Grade:
1,425
94,854
# Students in 8th Grade:
1,313
93,972
# Students in 9th Grade:
1,483
16,255
# Students in 10th Grade:
1,459
14,467
# Students in 11th Grade:
1,318
12,872
# Students in 12th Grade:
1,207
12,447
# Ungraded Students:
-
-
District Revenue and Spending
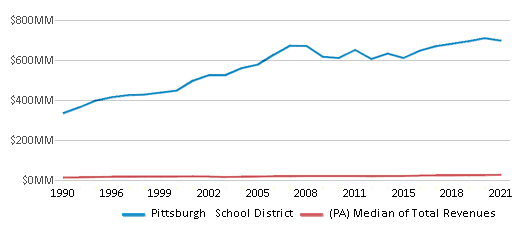
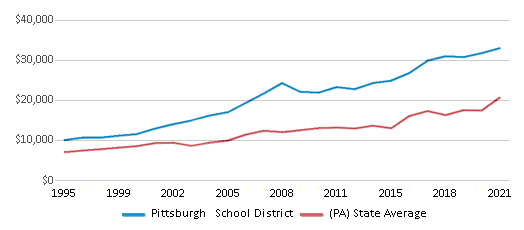
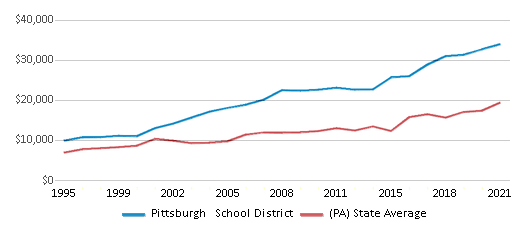
The revenue/student of $36,010 is higher than the state median of $23,696. The school district revenue/student has grown by 9% over four school years.
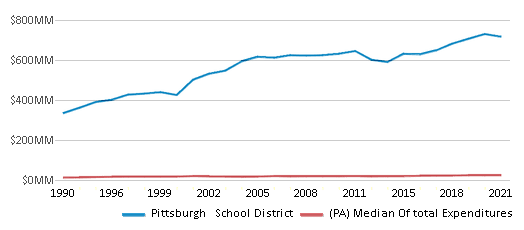
The school district's spending/student of $37,042 is higher than the state median of $23,119. The school district spending/student has grown by 9% over four school years.
Total Revenue
$697 MM
$39,541 MM
Spending
$717 MM
$38,578 MM
Revenue / Student
$36,010
$23,696
Spending / Student
$37,042
$23,119
Best Pittsburgh School District Public Elementary Schools (2025)
School
(Math and Reading Proficiency)
(Math and Reading Proficiency)
Location
Grades
Students
Rank: #11.
Pittsburgh Capa 6-12
(Math: 54% | Reading: 86%)
Rank:
Rank:
9/
Top 20%10
111 9th St
Pittsburgh, PA 15222
(412) 529-6100
Pittsburgh, PA 15222
(412) 529-6100
Grades: 6-12
| 826 students
Rank: #22.
Pittsburgh Montessori K-5
Magnet School
(Math: 60-64% | Reading: 70-74%)
Rank:
Rank:
9/
Top 20%10
201 S Graham St
Pittsburgh, PA 15206
(412) 529-2010
Pittsburgh, PA 15206
(412) 529-2010
Grades: PK-5
| 339 students
Rank: #33.
Pittsburgh Colfax K-8
(Math: 56% | Reading: 75%)
Rank:
Rank:
8/
Top 30%10
2332 Beechwood Blvd
Pittsburgh, PA 15217
(412) 529-3525
Pittsburgh, PA 15217
(412) 529-3525
Grades: K-8
| 741 students
Rank: #44.
Pittsburgh Science And Technology Academy 6-12
(Math: 51% | Reading: 70%)
Rank:
Rank:
8/
Top 30%10
107 Thackeray St
Pittsburgh, PA 15213
(412) 529-7620
Pittsburgh, PA 15213
(412) 529-7620
Grades: 6-12
| 610 students
Rank: #55.
Pittsburgh Greenfield K-8
(Math: 44% | Reading: 73%)
Rank:
Rank:
8/
Top 30%10
1 Alger St
Pittsburgh, PA 15207
(412) 529-3535
Pittsburgh, PA 15207
(412) 529-3535
Grades: PK-8
| 370 students
Rank: #66.
Pittsburgh Allegheny K-5
Magnet School
(Math: 43% | Reading: 57%)
Rank:
Rank:
6/
Top 50%10
810 Arch Street
Pittsburgh, PA 15212
(412) 529-4100
Pittsburgh, PA 15212
(412) 529-4100
Grades: PK-5
| 626 students
Rank: #77.
Pittsburgh Dilworth K-5
Magnet School
(Math: 41% | Reading: 56%)
Rank:
Rank:
5/
Bottom 50%10
6200 Stanton Ave
Pittsburgh, PA 15206
(412) 529-5000
Pittsburgh, PA 15206
(412) 529-5000
Grades: PK-5
| 434 students
Rank: #88.
Pittsburgh Fulton K-5
(Math: 25-29% | Reading: 55-59%)
Rank:
Rank:
4/
Bottom 50%10
5799 Hampton St
Pittsburgh, PA 15206
(412) 529-4600
Pittsburgh, PA 15206
(412) 529-4600
Grades: PK-5
| 291 students
Rank: #99.
Pittsburgh Minadeo K-5
(Math: 30-34% | Reading: 50-54%)
Rank:
Rank:
4/
Bottom 50%10
6502 Lilac St
Pittsburgh, PA 15217
(412) 529-4035
Pittsburgh, PA 15217
(412) 529-4035
Grades: PK-5
| 309 students
Rank: #1010.
Pittsburgh Brookline K-8
(Math: 31% | Reading: 54%)
Rank:
Rank:
4/
Bottom 50%10
500 Woodbourne Ave
Pittsburgh, PA 15226
(412) 529-7380
Pittsburgh, PA 15226
(412) 529-7380
Grades: PK-8
| 409 students
Rank: #1111.
Pittsburgh West Liberty K-5
(Math: 35-39% | Reading: 45-49%)
Rank:
Rank:
4/
Bottom 50%10
785 Dunster St
Pittsburgh, PA 15226
(412) 529-7420
Pittsburgh, PA 15226
(412) 529-7420
Grades: K-5
| 155 students
Rank: #1212.
Pittsburgh Concord K-5
(Math: 25-29% | Reading: 50-54%)
Rank:
Rank:
4/
Bottom 50%10
2350 Brownsville Rd
Pittsburgh, PA 15210
(412) 529-7755
Pittsburgh, PA 15210
(412) 529-7755
Grades: PK-5
| 466 students
Rank: #13 - 1413. - 14.
Pittsburgh Sunnyside K-8
(Math: 20-24% | Reading: 50-54%)
Rank:
Rank:
3/
Bottom 50%10
4801 Stanton Avenue
Pittsburgh, PA 15201
(412) 529-2040
Pittsburgh, PA 15201
(412) 529-2040
Grades: PK-8
| 247 students
Rank: #13 - 1413. - 14.
Pittsburgh Westwood K-5
(Math: 20-24% | Reading: 50-54%)
Rank:
Rank:
3/
Bottom 50%10
508 Shadyhill Road
Pittsburgh, PA 15205
(412) 529-6570
Pittsburgh, PA 15205
(412) 529-6570
Grades: K-5
| 259 students
Rank: #1515.
Pittsburgh Schiller 6-8
Magnet School
(Math: 15% | Reading: 54%)
Rank:
Rank:
3/
Bottom 50%10
1018 Peralta St
Pittsburgh, PA 15212
(412) 529-4190
Pittsburgh, PA 15212
(412) 529-4190
Grades: 6-8
| 260 students
Rank: #1616.
Pittsburgh Beechwood K-5
(Math: 25-29% | Reading: 40-44%)
Rank:
Rank:
3/
Bottom 50%10
810 Rockland Ave
Pittsburgh, PA 15216
(412) 529-7390
Pittsburgh, PA 15216
(412) 529-7390
Grades: PK-5
| 349 students
Rank: #1717.
Pittsburgh Arsenal 6-8
(Math: 20-24% | Reading: 45-49%)
Rank:
Rank:
3/
Bottom 50%10
220 40th Street
Pittsburgh, PA 15201
(412) 529-5740
Pittsburgh, PA 15201
(412) 529-5740
Grades: 6-8
| 162 students
Rank: #1818.
Pittsburgh Phillips K-5
Magnet School
(Math: 25-29% | Reading: 35-39%)
Rank:
Rank:
3/
Bottom 50%10
1901 Sarah St
Pittsburgh, PA 15203
(412) 529-5190
Pittsburgh, PA 15203
(412) 529-5190
Grades: K-5
| 213 students
Rank: #19 - 2019. - 20.
Pittsburgh Banksville K-5
(Math: 20-24% | Reading: 35-39%)
Rank:
Rank:
3/
Bottom 50%10
1001 Carnahan Rd
Pittsburgh, PA 15216
(412) 529-7400
Pittsburgh, PA 15216
(412) 529-7400
Grades: K-5
| 288 students
Rank: #19 - 2019. - 20.
Pittsburgh Woolslair K-5
(Math: 20-24% | Reading: 35-39%)
Rank:
Rank:
3/
Bottom 50%10
501 40th St
Pittsburgh, PA 15224
(412) 529-8800
Pittsburgh, PA 15224
(412) 529-8800
Grades: K-5
| 209 students
Rank: #2121.
Pittsburgh Linden K-5
Magnet School
(Math: 15-19% | Reading: 40-44%)
Rank:
Rank:
3/
Bottom 50%10
725 S Linden Ave
Pittsburgh, PA 15208
(412) 529-3996
Pittsburgh, PA 15208
(412) 529-3996
Grades: K-5
| 106 students
Rank: #2222.
Pittsburgh Carmalt K-8
Magnet School
(Math: 19% | Reading: 41%)
Rank:
Rank:
2/
Bottom 50%10
1550 Breining St
Pittsburgh, PA 15226
(412) 529-7760
Pittsburgh, PA 15226
(412) 529-7760
Grades: PK-8
| 565 students
Rank: #2323.
Pittsburgh Obama 6-12
Magnet School
(Math: 15% | Reading: 43%)
Rank:
Rank:
2/
Bottom 50%10
515 N. Highland Avenue
Pittsburgh, PA 15206
(412) 529-5980
Pittsburgh, PA 15206
(412) 529-5980
Grades: 6-12
| 737 students
Rank: #2424.
Pittsburgh Whittier K-5
(Math: 20-24% | Reading: 30-34%)
Rank:
Rank:
2/
Bottom 50%10
150 Meridan St
Pittsburgh, PA 15211
(412) 529-8211
Pittsburgh, PA 15211
(412) 529-8211
Grades: K-5
| 138 students
Rank: #2525.
Pittsburgh Grandview K-5
(Math: 15-19% | Reading: 35-39%)
Rank:
Rank:
2/
Bottom 50%10
845 Mclain St
Pittsburgh, PA 15210
(412) 529-6605
Pittsburgh, PA 15210
(412) 529-6605
Grades: K-5
| 186 students
Rank: #2626.
Pittsburgh South Brook 6-8
(Math: 10% | Reading: 40%)
Rank:
Rank:
2/
Bottom 50%10
779 Dunster St
Pittsburgh, PA 15226
(412) 529-8170
Pittsburgh, PA 15226
(412) 529-8170
Grades: 6-8
| 255 students
Rank: #27 - 2827. - 28.
Pittsburgh Liberty K-5
Magnet School
(Math: 10-14% | Reading: 30-34%)
Rank:
Rank:
2/
Bottom 50%10
601 Filbert St
Pittsburgh, PA 15232
(412) 529-8450
Pittsburgh, PA 15232
(412) 529-8450
Grades: K-5
| 242 students
Rank: #27 - 2827. - 28.
Pittsburgh Roosevelt K -5
(Math: 10-14% | Reading: 30-34%)
Rank:
Rank:
2/
Bottom 50%10
17 W Cherryhill Street
Pittsburgh, PA 15210
(412) 529-7780
Pittsburgh, PA 15210
(412) 529-7780
Grades: PK-5
| 237 students
Rank: #2929.
Pittsburgh Classical 6-8
Magnet School
(Math: 6% | Reading: 37%)
Rank:
Rank:
2/
Bottom 50%10
1463 Chartiers Ave
Pittsburgh, PA 15220
(412) 529-3110
Pittsburgh, PA 15220
(412) 529-3110
Grades: 6-8
| 276 students
Rank: #3030.
David B. Oliver Citywide Academy
Special Education School
(Math: ≤20% | Reading: ≤20%)
Rank:
Rank:
2/
Bottom 50%10
2323 Brighton Rd
Pittsburgh, PA 15212
(412) 529-3125
Pittsburgh, PA 15212
(412) 529-3125
Grades: 3-12
| 50 students
Rank: #31 - 3231. - 32.
Pittsburgh Allegheny 6-8
Magnet School
(Math: ≤5% | Reading: 35-39%)
Rank:
Rank:
2/
Bottom 50%10
810 Arch Street
Pittsburgh, PA 15212
(412) 529-4115
Pittsburgh, PA 15212
(412) 529-4115
Grades: 6-8
| 175 students
Rank: #31 - 3231. - 32.
Pittsburgh Online Academy
(Math: ≤5% | Reading: 35-39%)
Rank:
Rank:
2/
Bottom 50%10
341 S. Bellefield Avenue
Pittsburgh, PA 15213
(412) 529-3510
Pittsburgh, PA 15213
(412) 529-3510
Grades: 4-12
| 104 students
Rank: #3333.
Pittsburgh Weil K-5
(Math: 15-19% | Reading: 15-19%)
Rank:
Rank:
2/
Bottom 50%10
2250 Centre Ave
Pittsburgh, PA 15219
(412) 529-3840
Pittsburgh, PA 15219
(412) 529-3840
Grades: PK-5
| 193 students
Rank: #34 - 3634. - 36.
Pittsburgh Arsenal K-5
(Math: 10-14% | Reading: 20-24%)
Rank:
Rank:
2/
Bottom 50%10
215 39th St
Pittsburgh, PA 15201
(412) 529-5307
Pittsburgh, PA 15201
(412) 529-5307
Grades: PK-5
| 321 students
Rank: #34 - 3634. - 36.
Pittsburgh Manchester K-8
(Math: 10-14% | Reading: 20-24%)
Rank:
Rank:
2/
Bottom 50%10
1612 Manhattan St
Pittsburgh, PA 15233
(412) 529-3100
Pittsburgh, PA 15233
(412) 529-3100
Grades: PK-8
| 163 students
Show 15 more public schools in Pittsburgh School District (out of 50 total schools)
Loading...
Recent Articles

What Is A Charter School?
Explore the world of charter schools in this comprehensive guide. Learn about their history, how they operate, and the pros and cons of this educational innovation. Discover key facts about charter schools, including admission policies, demographics, and funding, as well as what to look for when considering a charter school for your child.

10 Reasons Why High School Sports Benefit Students
Discover the 10 compelling reasons why high school sports are beneficial for students. This comprehensive article explores how athletics enhance academic performance, foster personal growth, and develop crucial life skills. From improved fitness and time management to leadership development and community representation, learn why participating in high school sports can be a game-changer for students' overall success and well-being.

February 05, 2025
Understanding the U.S. Department of Education: Structure, Impact, and EvolutionWe explore how the Department of Education shapes American education, from its cabinet-level leadership to its impact on millions of students, written for general audiences seeking clarity on this vital institution.


